Figures & data
Figure 1. Peakforce AFM images of graphene-covered SiO2 nanoparticle film. (a) AFM topographic data. (b) Adhesion map corresponding to the area in (a). (c) Line section along the white line in (a).
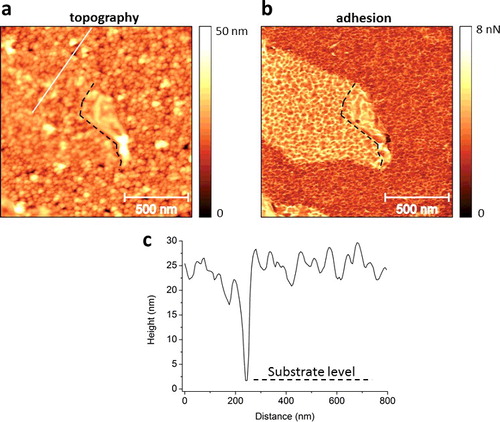
Figure 2. Peakforce AFM images of SiO2 nanoparticle-supported graphene measured at a tip-sample force of (a) 1 nN and (b) 40 nN. (c) Height profiles along the line sections in (a) and (b) (black lines).
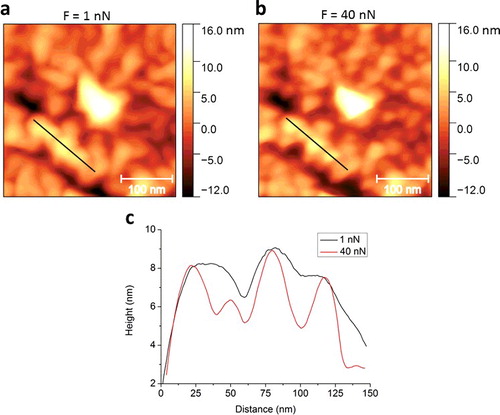
Figure 3. (Colour online) Simultaneously acquired peakforce AFM images of graphene-covered nanoparticles after annealing. (a) Topography measured at a peakforce of 8 nN. (b) Adhesion. (c) Deformation. (d) Typical force-distance curve (after Ref. [Citation15]) indicating how adhesion and deformation data are extracted. Both the ‘approach’ (blue line) and the ‘withdraw’ (red dotted line) curves are displayed. Graphene is either directly supported by NPs (e.g. the areas denoted with blue circles in (a)–(c)) or it is suspended between them (e.g. the areas denoted with black (a) and white circles in (a) and (c)).
![Figure 3. (Colour online) Simultaneously acquired peakforce AFM images of graphene-covered nanoparticles after annealing. (a) Topography measured at a peakforce of 8 nN. (b) Adhesion. (c) Deformation. (d) Typical force-distance curve (after Ref. [Citation15]) indicating how adhesion and deformation data are extracted. Both the ‘approach’ (blue line) and the ‘withdraw’ (red dotted line) curves are displayed. Graphene is either directly supported by NPs (e.g. the areas denoted with blue circles in (a)–(c)) or it is suspended between them (e.g. the areas denoted with black (a) and white circles in (a) and (c)).](/cms/asset/f64cf728-a3eb-448b-8020-c75fa6bc6825/tjen_a_1159741_f0003_oc.jpg)
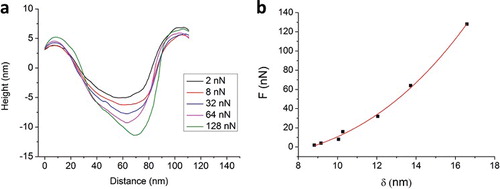
Figure 4. (Colour online) Nanoindentation performed on the suspended graphene nanomembrane marked with black circle in (a). (a) Height profiles taken along the same line section (white line in (a)), measured at different load forces (F). (b) Force-deflection data.