
Figures & data
Table 1. Mathematical models used to predict drug release mechanism.
Figure 1. Phase solubility of piroxicam in different concentrations of the polymer Soluplus®.
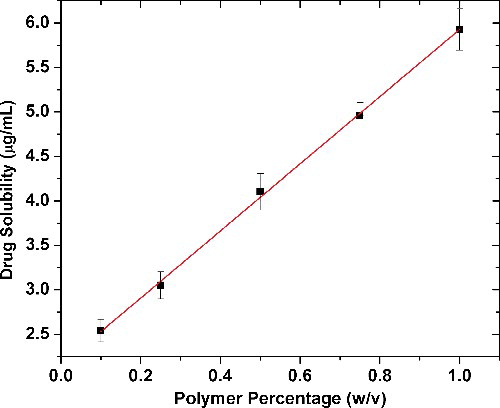
Figure 2. Gibbs free energy of transfer values with increasing Soluplus concentrations.
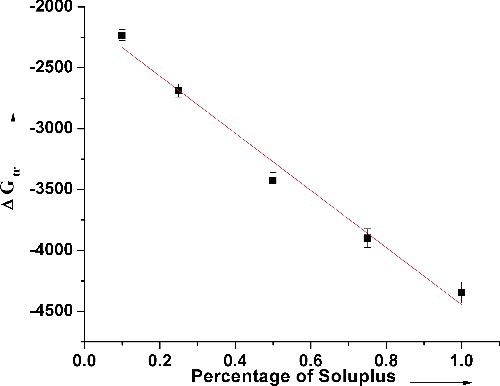
Figure 3. Overlay of the PXRD patterns of piroxicam, Soluplus® and the nanoformulations.
Figure 4. Overlay of the thermal analysis curves of piroxicam, Soluplus® and the nanoformulations.
Figure 5. Overlay of FTIR spectra of piroxicam, Soluplus® and the nanoformulations.
Figure 6. FESEM images of Piroxicam Soluplus Nanoformulations of ratios 2:1 (above) and 1:1 (Below) after 6 hours of milling.
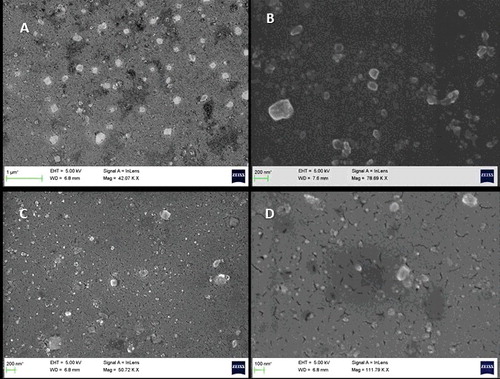
Figure 7. Caco-2 cell viability after exposure to various concentrations of Soluplus® and the nanoformulations (NS PS 1:1 and 1:4 for 12 hours). Significantly different with respect to control: *p < 0.05, #p < 0.05.
Figure 8. Dissolution analysis of the nanoformulations in comparison of the pure drug.
Table 2. Dissolution efficiencies achieved with varying polymer content in the formulations.
Table 3. Statistical parameters obtained after fitting the drug release data to various release kinetic models.