Figures & data
Figure 1. Typical SEM micrograph of the CNTNs on glass substrates. The scale bare is 10 µm.
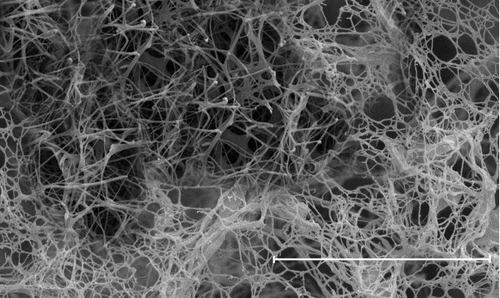
Figure 2. TEM images of the (a) as-deposited CuO on cellulose fibres, (b) sample which heated at 300 °C for 10 min, (c) the CNTNs which heated at 300 °C for 30 min. The scale bare is 100 nm.
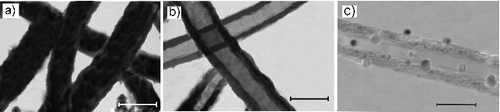
Figure 3. Optical transmission of deposited CuO on cellulose fibres which heated at 300 °C for different times of 0, 5 and 10 min.
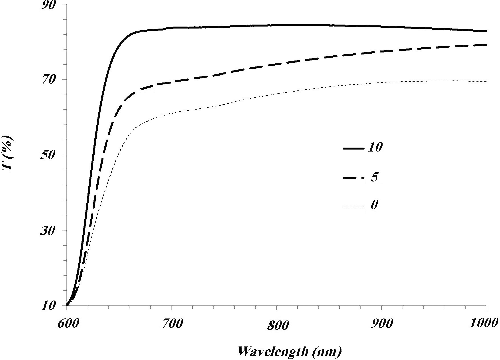
Figure 4. XRD pattern of the CNTNs.
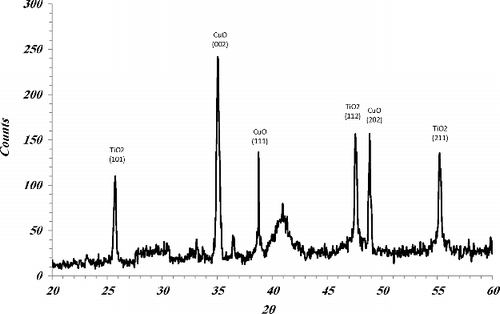
Figure 5. Experimental absorption of the CNTNs on glass substrate and calculated absorption, scattering and extinction cross sections of the CNTNs.
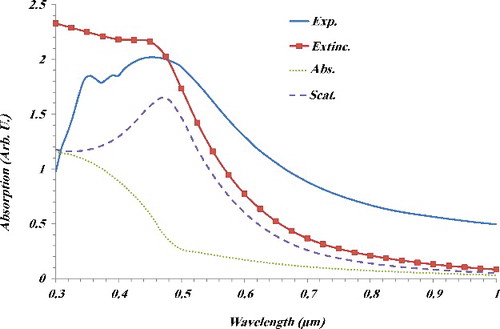
Figure 6. Graph of (αhν)1/2 versus hν (eV).
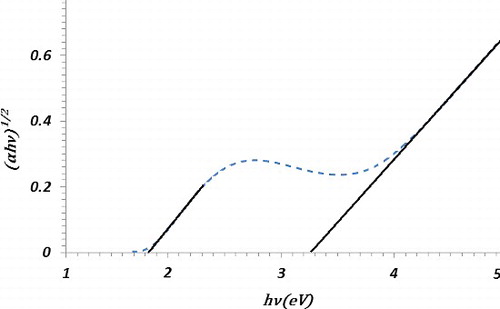
Figure 7. Schematic view of simulated CNTN. The values of the inner and outer radius of CuO nanotube are r1 = 25 nm and r2= 50 nm. Moreover, the length of nanotube and diameter of TiO2 nanoparticles are fixed at L = 2 µm and D = 20 nm.
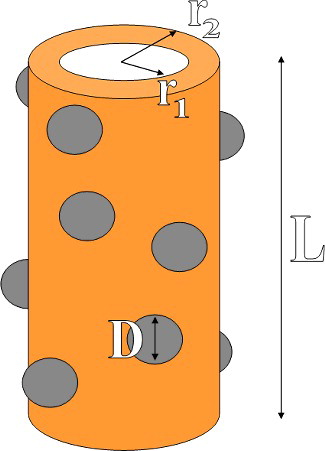
Figure 8. Follow-up of the methyl orange oxidation up to 2 h of reaction time under visible light (633 nm helium–neon laser).
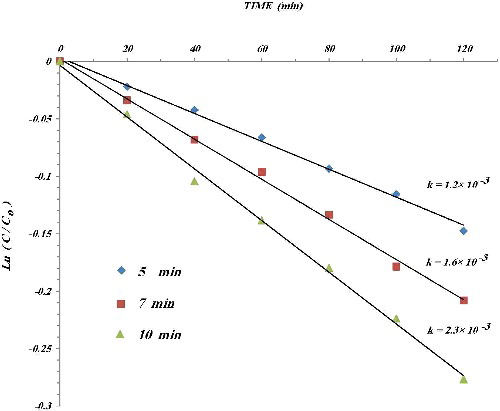
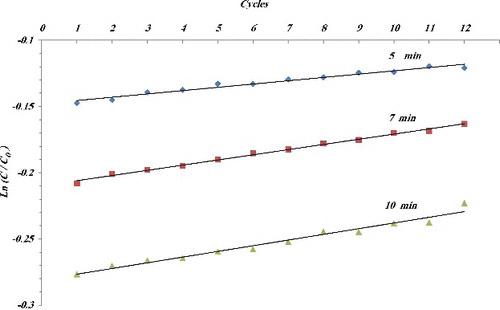
Figure 9. Variation of value of Ln(C/C0) at end of 2 h irradiation of 633 nm helium–neon laser versus number of cycles for different annealing time.