Figures & data
Figure 1. Absorbance at 590 nm for copper nanoparticles synthesised by Streptomyces griseus cells. (a) Sample and (b) control.
Figure 2. TEM images of copper nanoparticles synthesised by S. gresius at various magnifications. TEM images of copper nanoparticles at various magnifications and different nanosize distribution (a–d).
Figure 3. Biosynthesised copper nanoparticle size distribution.
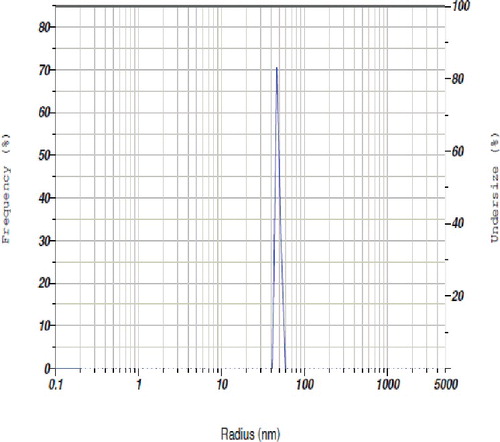
Figure 4. XRD pattern of biosynthesised copper nanoparticles.
Figure 5. Fourier transform infrared spectroscopy analysis of copper nanoparticles.
Table. 1. Edaphic parameters of P. hypolateritia infested tea soil in response to bulk and nano copper during 2011–2014.
Table 2. Effect of fungicide, bulk and nanocopper on red root-rot disease incidence and leaf yield during 2011–2014.
Figure 6. Total population of bacteria, fungi and actinomycetes in copper nanoparticles applied to tea soil.