
Figures & data
Table 1. Entrapment efficiency and vesicle size of different proniosomal formulations.
Figure 1. Photomicrograph of proniosomal formulation F3S60 (A). SEM image of niosomes formed after hydration of F3S60 (B), F10SCL (C) and F11SCH (D).
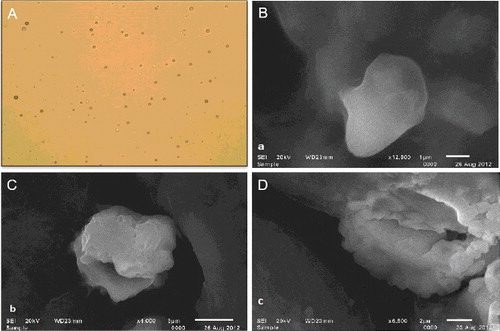
Figure 2. DSC thermograms of bromocriptine proniosomes (A), blank proniosomes (B), span 60 (C) and bromocriptine (D).
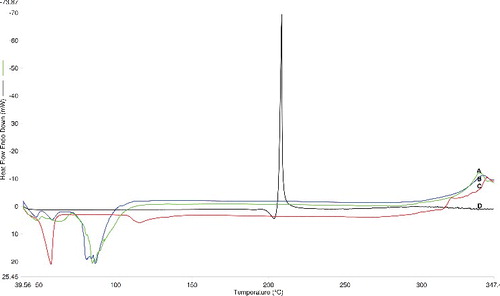
Figure 3. In vitro drug release from proniosomes prepared using different cholesterol (A) and drug (B) content (n = 3). Amount of cholesterol was 5 mg (F10SCL), 10 mg (F3S60) and 15 mg (F11SCH), and the amount of bromocriptine was 3 mg (F14SDL), 5 mg (F3S60) and 7 mg (F15SDH).
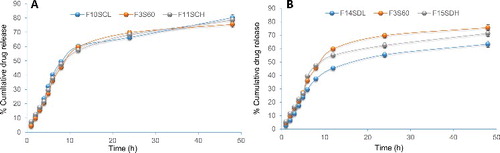
Figure 4. Ex vivo release of bromocriptine from proniosomes and drug dispersion (n = 3).
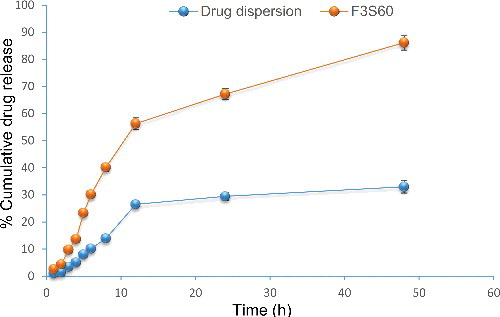
Table 2. Permeation parameters of drug dispersion and proniosomal formulation.
Table 3. Stability study of the optimised proniosomal formulation (F3S60).