Figures & data
Figure 1. Forces exerted on particles in drilling fluid and on the cake surface.
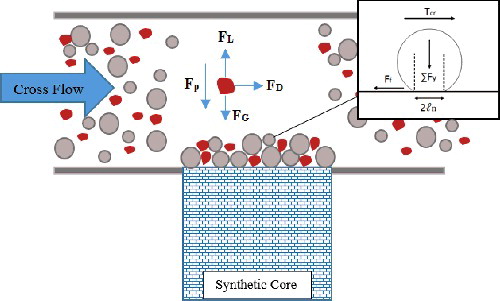
Figure 2. Critical deposition zone in front of porous media and its reduction with the filtration time.
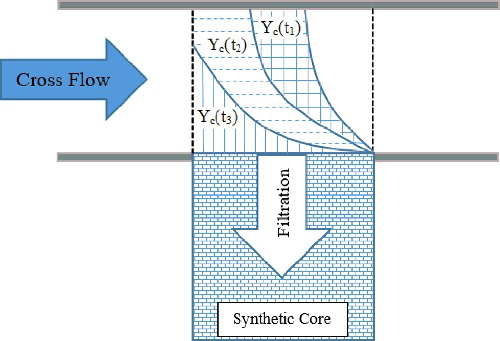
Figure 3. Designed cross-flow filtration and mud cake buildup simulator set-up. Filtration cell and O-ring along with sealant is depicted at the top right of the picture. At the bottom right of the picture, mud cake formed after circulation is illustrated; (a) Fresh drilling fluid mud cake, (b) MWCNTs fluid mud cake, (c) nano-SiO2 fluid mud cake and (d) nano CaCO3 fluid mud cake.
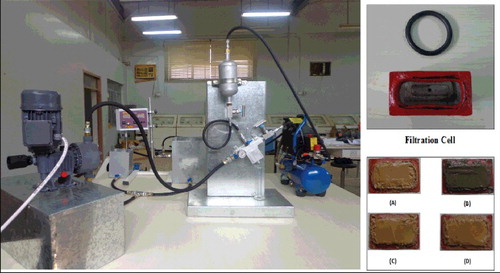
Figure 4. Rheological properties of different drilling fluid samples based on power law model.
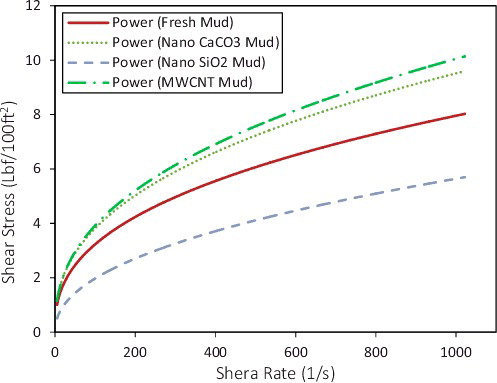
Table 1. Drilling fluid samples characteristics.
Table 2. Solid particles characteristics obtained by DLS and literature.
Table 3. Deposition and erosion intensity indexes measured for solid particles.
Figure 5. Particle size distribution of drilling fluid samples measured by DLS technique.
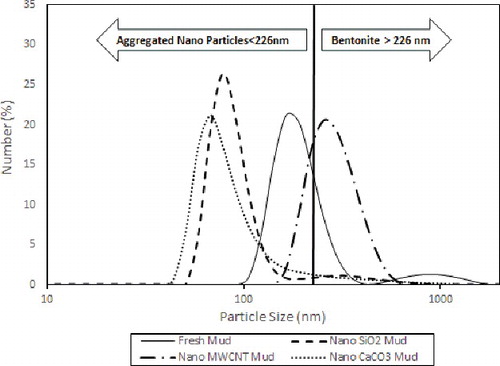
Figure 6. Aggregated structure of nanoparticles in drilling fluids proposed by fractal dimension analysis.
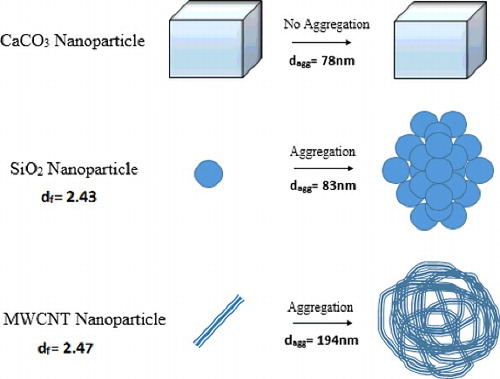
Figure 7. FESEM images taken from mud cake after dynamic filtration test. (a) fresh mud cake with bentonite particles, (b) nano-SiO2 mud cake, (c) nano-CaCO3 mud cake and (d) MWCNTs mud cake.
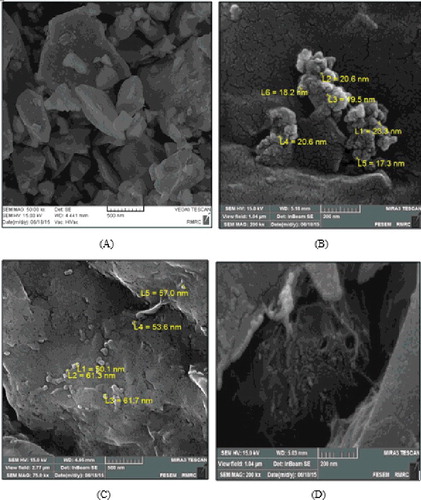
Figure 8. Filtration rate reduction during test and dynamic equilibrium achievement for four drilling fluid samples at horizontal and vertical position. (a) Fresh mud, (b) nano-SiO2 mud, (c) nano-CaCO3 mud and (d) MWCNTs mud.
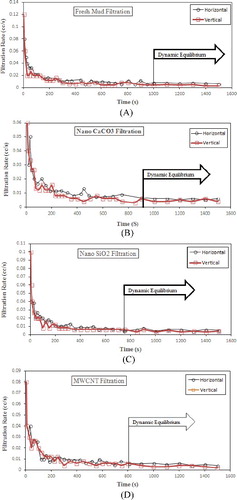
Table 4. Vertical force ∑Fy, particle depositional acceleration ay and possible depositional volume Vc exerted on bentonite computed by model for fresh mud at different inclinations.
Table 5. Vertical force ∑Fy, particle depositional acceleration ay and possible depositional volume Vc exerted on particles computed by model for nano-SiO2 mud at different inclinations.
Table 6. Vertical force ∑Fy, particle depositional acceleration ay and possible depositional volume Vc exerted on particles computed by model for nano-CaCO3 mud at different inclinations.
Table 7. Vertical force ∑Fy, particle depositional acceleration ay and possible depositional volume Vc exerted on particles computed by model for nano-MWCNTs mud at different inclinations.
Table 8. Erosion parameters (vertical force ∑Fy, shear stress τ, critical shear stress τcr and mud cake surface occupied by particle Sp) exerted on aggregated particles on the cake surface for four drilling fluid samples.
Table 9. Mud cake thickness, hc, weight ratio of nanoparticle and bentonite on the cake, Mr, comparison between model and experimental outputs after 300 sec circulation for studied drilling fluids.
Figure 9. Mud cake buildup during dynamic filtration test for different drilling fluid samples at vertical position predicted by the model.
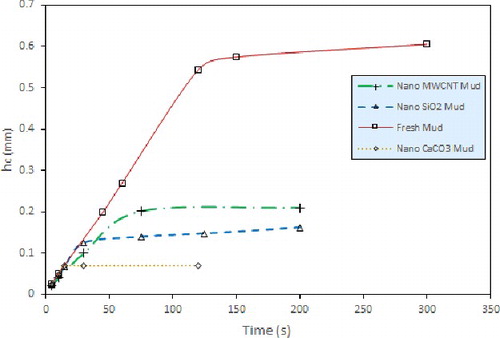
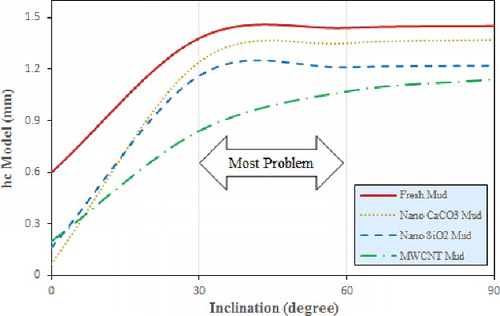
Figure 10. Variation of mud cake thickness at different well inclinations for four drilling fluid samples predicted by the model to analyse hole problems related to mud cake buildup.