Figures & data
Figure 1. (Colour online). Photographs of fibres with different weight ratios of GO and sodium cellulose xanghate: (a) pure cellulose, (b) 1:1, (c) 2:1, (d) 3:1, (e) 4:1, and (f) 5:1.
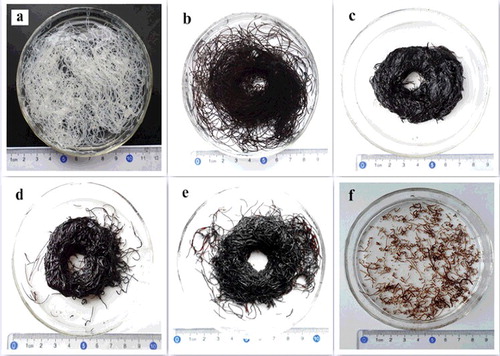
Figure 2. SEM images of cellulose fibres (a, b) and CGO fibres (c, d).
Figure 3. (Colour online). (a) FT-IR spectra of cellulose, GO, and CGO fibres. (b) TGA and DTA curves of CGO fibres.
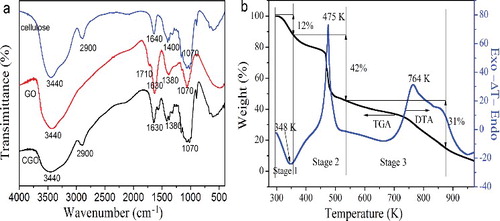
Figure 4. (Colour online). Comparison of the adsorption capacity (qe) of the fibres with different weight ratios of GO and sodium cellulose xanghate (initial MB concentration: 160 mg/L, pH: 6.0, dosage: 20 mg, and temperature: 298 K).
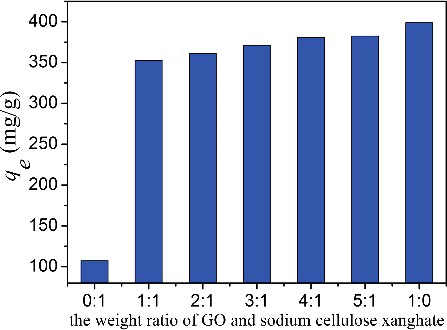
Figure 5. (Colour online). (a) Effect of adsorbent dosage (initial MB concentration: 160 mg/L, pH: 6.0, and temperature: 298 K). (b) Effect of solution pH (initial MB concentration: 160 mg/L, dosage: 20 mg, and temperature: 298 K).
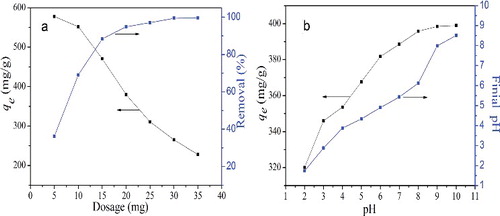
Figure 6. (Colour online). Effect of initial MB concentration and temperature on the adsorption of MB onto CGO fibres (pH: 6.0, dosage: 20 mg).
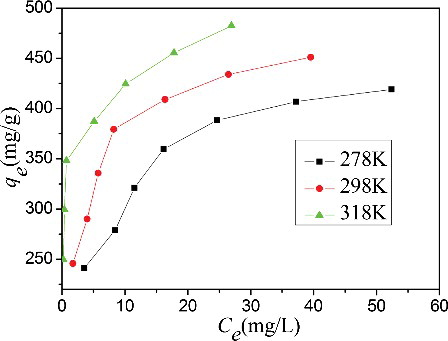
Table 1. Parameters of Langmuir and Freundlich models for the adsorption of MB onto CGO fibres.
Table 2. Maximum adsorption capacity for MB onto various adsorbents.
Figure 7. (Colour online). (a) Effect of constant contact time on the adsorption of MB onto CGO fibres (initial MB concentration: 160 mg/L, pH: 6.0, dosage: 20 mg, and temperature: 298 K). Adsorption kinetics of MB onto CGO fibres, (b) pseudo-first-order; (c) pseudo-second-order; and (d) intra-particle diffusion models.
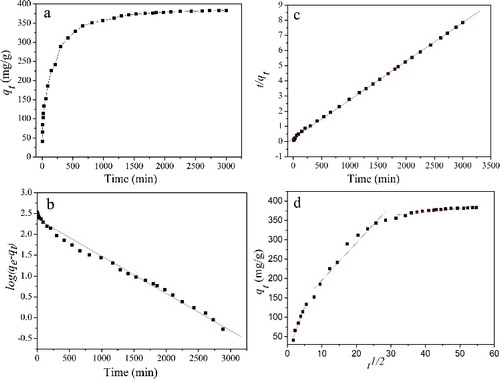
Table 3. Parameters of pseudo-first-order and pseudo-second-order and intra-particle diffusion models for the adsorption of MB onto CGO fibres.
Table 4. Thermodynamic parameters at different temperatures.
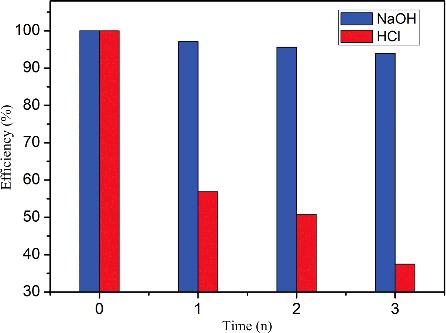
Figure 8. (Colour online). Regeneration and reuse of CGO fibres. The labels of NaOH and HCI represent the relative capacity after NaOH solution and HCI solution washing, respectively (initial MB concentration: 160 mg/L, dosage: 20 mg, temperature: 298 K, and pH: 6).