
Figures & data
Figure 1 . Synthetic route for preparation of DBD. Two drops of acetic acid are used to catalyse the reaction.
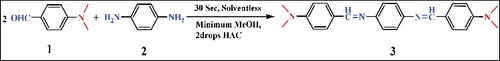
Figure 2. Suggested fragmentation of DBD.
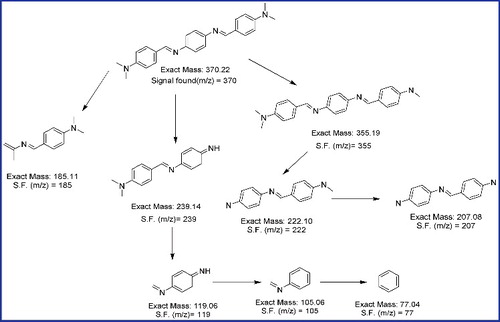
Figure 3. Atomic force microscope (AFM) images of (a) DBD nanoparticles in H2O CTAB, with diameters around 55 nm (b) DBD in H2O with diameters around 75 nm (c) DBD in H2O triton, with diameters around 90 nm.
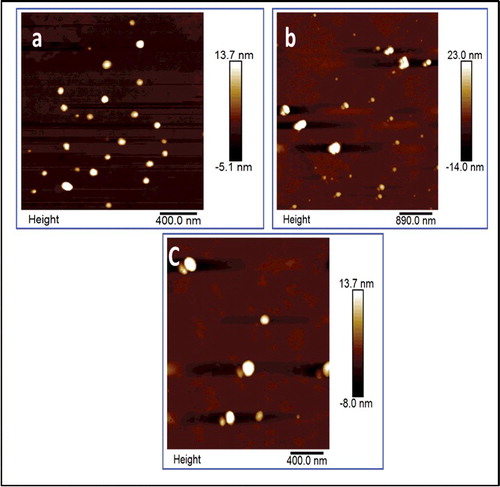
Figure 4. (a) Photograph showing DBD in solution (dissolved in THF) and DBD as nanoparticles (in aqueous solution). (b) Normalised absorption spectra of DBD in THF solution and as nanoparticles with and without surfactants. (c) Normalised photoluminescence spectra. DBD in THF gives almost no emission. (d) Comparing emission spectra of DBD/H2O in HAC to DBD/H2O triton.
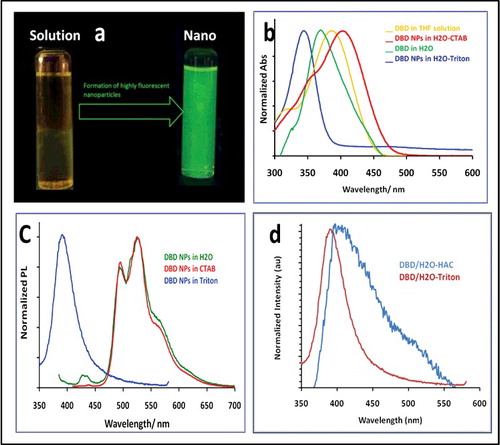
Figure 5. Photographs of DBD spot in the absence of chloroform vapour (left) and after exposure to chloroform vapour for one hour (middle) and three hours (right). The spot was illuminated under UV 365 nm light.
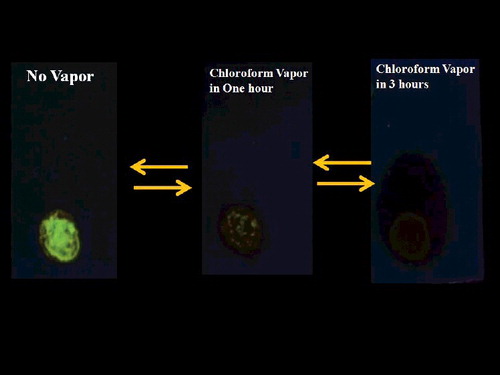
Table 1. Photophysical behaviour of DBD in solution and DBD nanoparticles.