
Figures & data
Figure 1. UV-Visible spectra of (a) uncapped and (b) L-Ser capped Fe3O4 NPs.
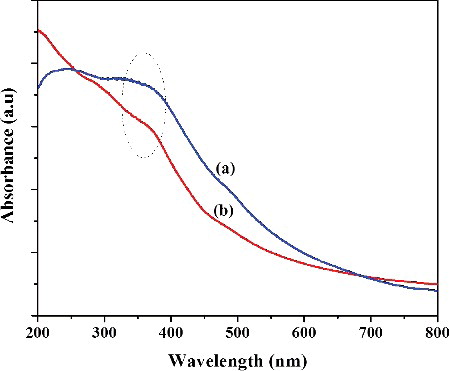
Figure 2. The powder XRD patterns of (a) uncapped Fe3O4 NPs and (b) L-Ser capped Fe3O4 NPs.
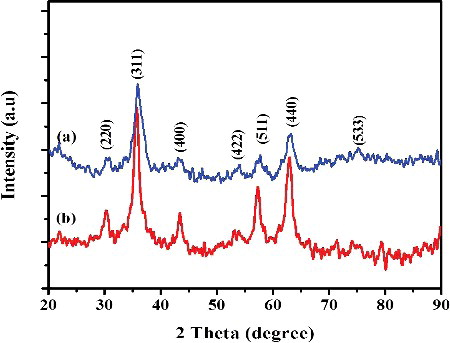
Figure 3. FTIR spectra of (a) uncapped and (b) L-Ser capped Fe3O4 NPs.
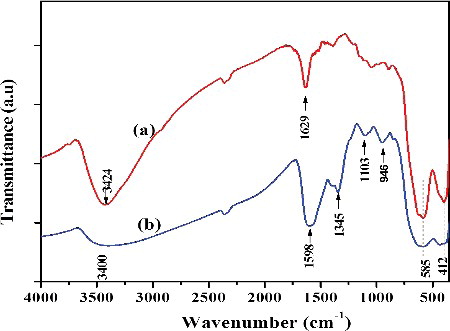
Figure 4. Representative SEM images (a–c) of L-Ser capped Fe3O4 and (d) EDS spectrum and the relative percent weight analysis (inset) of L-Ser capped Fe3O4 NPs.
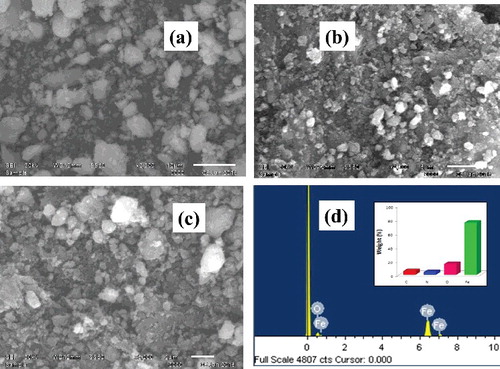
Figure 5. (a,b) Representative TEM images of L-Ser capped Fe3O4 NPs, (c) selected area electron diffraction patterns and (d) size distribution histogram.
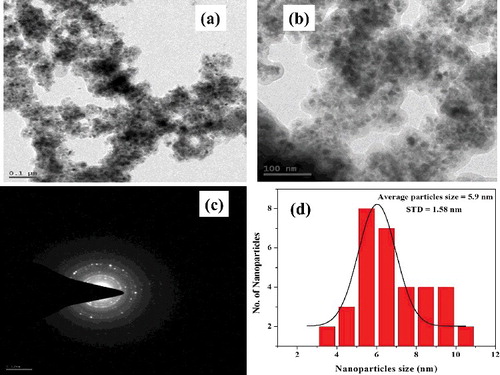
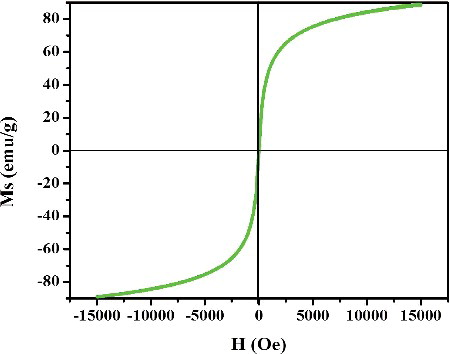
Figure 6. Vibrating sample magnetometer (VSM) curve of L-Ser capped Fe3O4 NPs at room temperature.
Scheme 1. Effect pH on charge of L-Serine.
Figure 7. Plausible interaction mechanisms of L-Ser to Fe3O4 NPs through (a) carboxyl bi-dentate, (b) carboxyl mono-dentate and (c) amino groups.
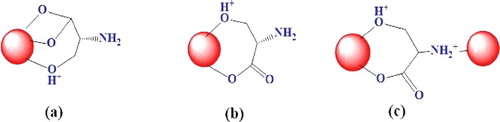
Figure 8. (a) Effect of adsorbent type for adsorption of RhB (5 mg⋅L−1) and (b) effect of RhB concentration on percent removal (%) onto L-Ser capped Fe3O4 NPs.
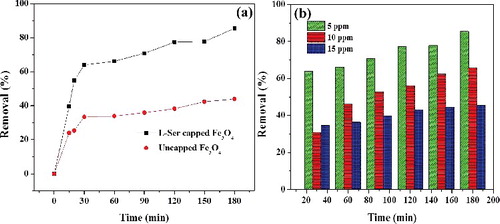
Figure 9. (a) Pseudo-first-order and (b) pseudo-second-order plots for adsorption of RhB on L-Ser capped Fe3O4 NPs at varying initial concentration of RhB (error bar represents 5% error).
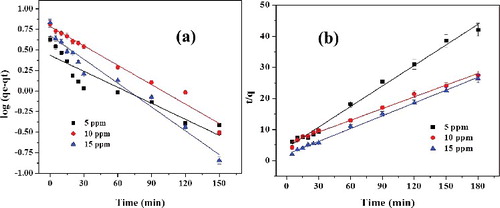
Table 1. The pseudo-first-order and pseudo-second-order kinetics parameters of RhB adsorption on L-Ser capped Fe3O4 NPs.
Figure 10. (a) Effect of RhB concentration on amount of dye adsorbed on L-Ser capped Fe3O4 NPs (qt), (b) Langmuir isotherm, (c) Freundlich isotherm (d) Tempkin isotherm models.
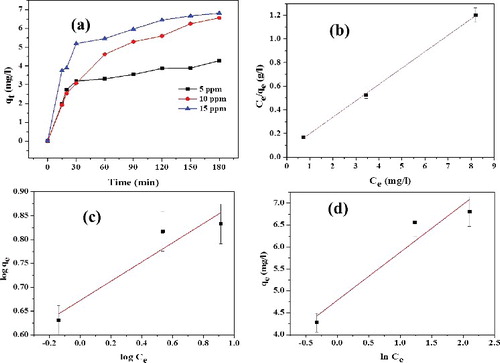
Table 2. Langmuir, Freundlich and Tempkin adsorption isotherms’ parameters for the adsorption of RhB onto L-Ser capped Fe3O4 NPs.
Figure 11. Effect of temperature on (a) adsorption efficiency and (b) van't Hoff plot (5% error bar) for adsorption of RhB (10 ppm) onto of L-Ser capped Fe3O4 NPs.
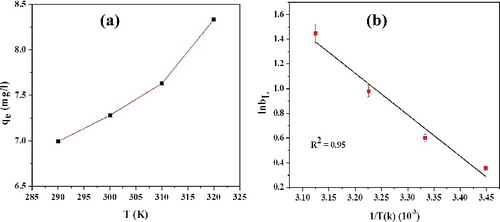
Table 3. Thermodynamic parameters for the adsorption of RhB onto L-Ser capped Fe3O4 NPs.