
Figures & data
Figure 1. TEM with different magnifications of nano-WS2.
Figure 2. (a,b) SEM of micro-WS2 under different magnifications.
Table 1. Contents of WS2 and ionic liquid as lubricant additives.
Figure 3. Friction coefficient of the sample oil with different WS2 morphology, diverse concentrations of WS2 and ionic liquid: (a) 2 µm; (b) 90 nm; (c) 2 µm + ionic liquid; (d) 90 nm + ionic liquid.
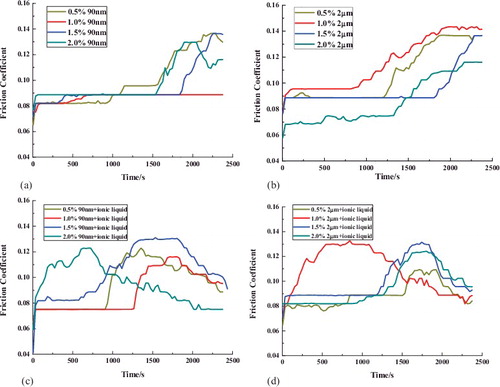
Figure 4. Comparison among the four optimum amounts of nano-WS2 groups and base oil.
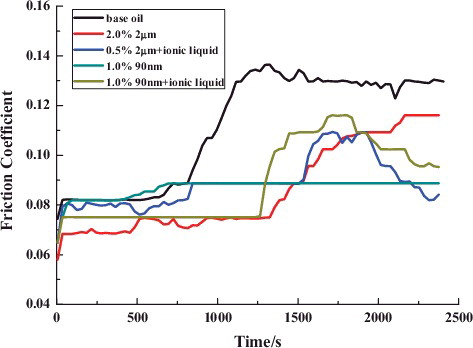
Figure 5. Contrast tests among base oil, nano-WS2 + ionic liquid for 5400 s.
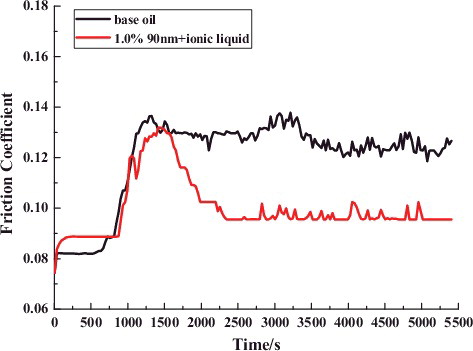
Figure 6. Optical micrographs of the typical wear scars on the bottom balls lubricated by the sample oil: (a) base oil; (b) 1%, 90 nm WS2; (c) 1%, 90 nm WS2 and ionic liquid; (d) 0.5% 2 µm WS2 and ionic liquid; (e) 2% 2 µm WS2.
Figure 7. Magnification of the optical micrographs of the wear scars: (a) base oil; (b) 1%, 90 nm WS2; (c) 2% 2µm WS2.
Table 2. Average WSD of steel balls with different lubricants.