Figures & data
Table 1. Water chemistry analysis of algae and daphnia culture media.
Figure 1. SEM images of TiO2 nanoparticles dispersal in (a) ultrapure water, (b) BG-11, and (c) SM7.
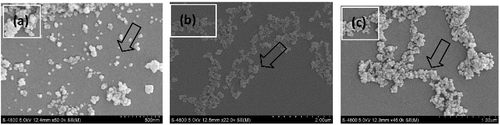
Table 2. Hydrodynamic diameter (dH), polydispersity index (PDI), zeta potential (ζ), and pH measurements of TiO2 nanoparticles in culture media at a 20 ppm TiO2 concentration.
Table 3. Zeta potential (ζ) and pH measurements of nTiO2 at 20 ppm in culture media of different arsenate concentrations.
Figure 2. TiO2 agglomerate size as determined by DLS analysis, increasing with increasing TiO2 nanoparticle concentration. Error bar: mean ± SD (n = 3). *denotes statistical differences from the control with p-values of P < 0.001.
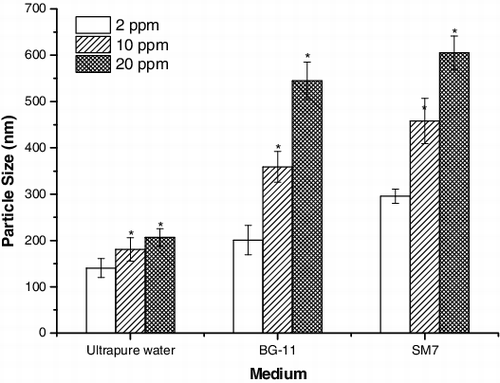
Figure 3. Sedimentation of TiO2 nanoparticles under different TiO2 nanoparticle concentrations.
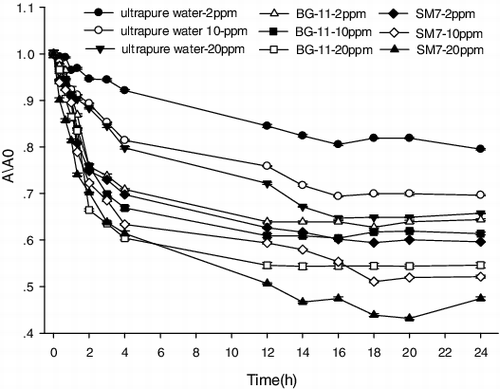
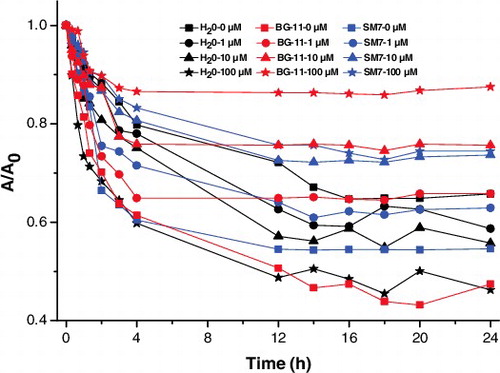
Figure 4. Effects of arsenate concentration on TiO2 nanoparticles dispersion. nTiO2 concentration was 20 ppm for all media. Error bar: mean ± SD (n = 3). *denotes statistical differences from the control with P-values of <0.001.
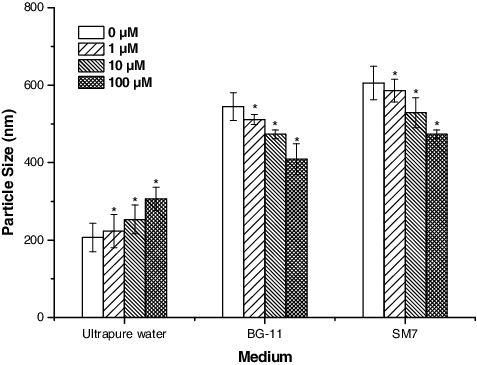
Figure 5. Sedimentation of TiO2 nanoparticles under different arsenate concentrations. nTiO2 concentration was 20 ppm for all media.