Figures & data
Table 1. Intravenous route of administration of three different concentrations for Bio-AgNPs: Experiment (A).
Table 2. Intraperitoneal route of administration of three different concentration for Bio-AgNPs: Experiment (B).
Table 3. Haematology study for rat treated with biogenic nanoparticles through intravenous and intraperitoneal route of administration after 14th and 28th day of observation.
Figure 1. Change in body weight for untreated (control) and treated rats with Bio-AgNPs through (A) intraperitoneal (i/p), (B) intravenous (i/v) route of administration up to 28th day of observation. *All treatments of Bio-AgNPs (Ag) at their total lethal concentration were administered through i/v and i/p and kept in observation for 28 days; N = 6 rats per group.
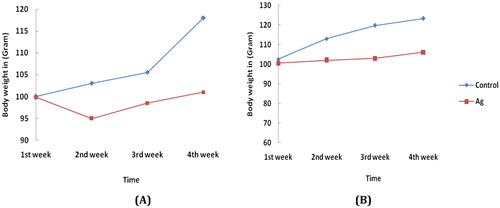
Table 4. Body weight changes for rat treated with biogenic nanoparticles through intravenous and intraperitoneal route of administration.
Figure 2. Biochemical results for rats treated with Bio-NPs through intraperitoneal and intravenous route of administration at [A] 14th day and [B] 28th day. Note: Ag: Bio-AgNPs, i/p: intraperitoneal, i/v: intravenous. *All data are expressed in mean ± SD of the mean of the three independent experiments; each was carried out in triplicate, N = 6 rats per group.
![Figure 2. Biochemical results for rats treated with Bio-NPs through intraperitoneal and intravenous route of administration at [A] 14th day and [B] 28th day. Note: Ag: Bio-AgNPs, i/p: intraperitoneal, i/v: intravenous. *All data are expressed in mean ± SD of the mean of the three independent experiments; each was carried out in triplicate, N = 6 rats per group.](/cms/asset/5a6167fc-64ed-411d-954f-977cd83538f0/tjen_a_1502479_f0002_c.jpg)
Table 5. Biochemical assays for rat treated with biogenic nanoparticles through intraperitoneal and intravenous route of administration for 14th and 28th day of observation.
Table 6. Weight of organs or organ index (OrganX) for rat treated with biogenic nanoparticles through intraperitoneal and intravenous route of administration for 14th and 28th day of observation.
Figure 3. H&E staining of rat kidney. (A) Untreated rat for 14th day (−); (B) Untreated rat for 28th day, normal kidney tissues glomerular cells, bowman capsule (−); (C) Rats treated with Bio-AgNPs, i/p route for 14th day (−); (D) Rats treated with Bio-AgNPs, i/p route for 28th day (+); (E) Rats treated with Bio-AgNPs, i/v route for 14th day (+); (F) Rats treated with Bio-AgNPs, i/v route for 28th day (−). *where (−) indicates no changes, (+) indicates mild changes, (++) indicates moderate changes, (+++) indicates severe changes.
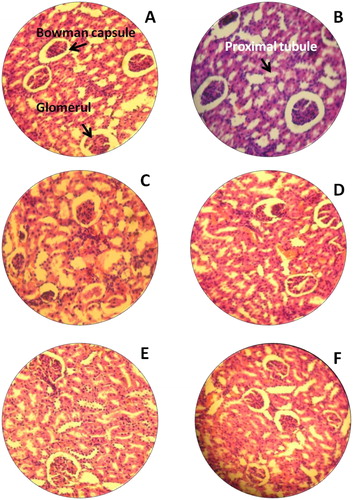
Figure 4. H&E staining of rat spleen. (A) Untreated rat for 14th day (−); (B) Untreated rat for 28th day, normal spleen tissues white palp and red palp (−); (C) Rats treated with Bio-AgNPs, i/p route for 14th day (+); (D) Rats treated with Bio-AgNPs, i/p route for 28th day (−); (E) Rats treated with Bio-AgNPs, i/v route for 14th day (−); (F) Rats treated with Bio-AgNPs, i/v route for 28th day (−). *where (−) indicates no changes, (+) indicates mild changes, (++) indicates moderate changes, (+++) indicates severe changes.
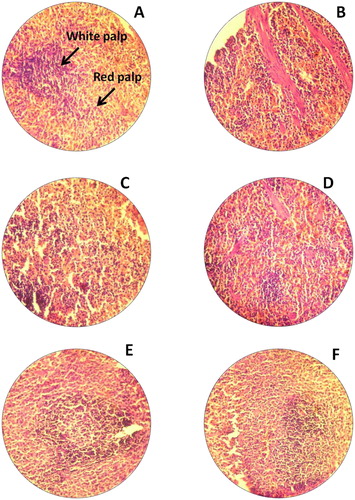
Figure 5. H&E staining of rat liver. (A) Untreated rat for 14th day (−); (B) Untreated rat for 28th day, normal liver tissues central vein and sensual (−); (C) Rats treated with Bio-AgNPs, i/p route for 14th day (+); (D) Rats treated with Bio-AgNPs, i/p route for 28th day(−); (E) Rats treated with Bio-AgNPs, i/v route 14th day (+); (F) Rats treated with Bio-AgNPs, i/v route for 28th day (−). *where (−) indicates no changes, (+) indicates mild changes, (++) indicates moderate changes, (+++) indicates severe changes.
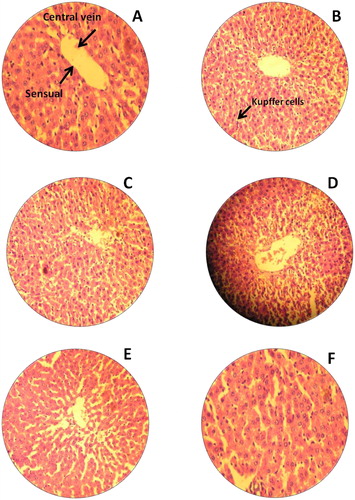
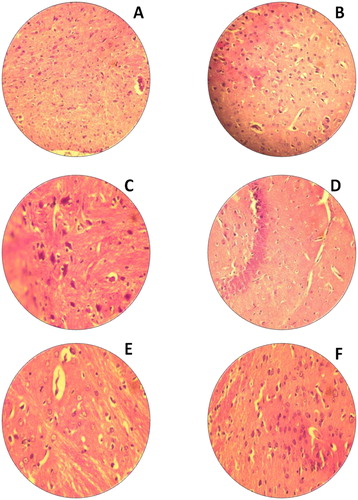
Figure 6. H&E staining of rat brain. (A) Untreated rat for 14th day (−); (B) Untreated rat for 28th day (−); (C) Rats treated with Bio-AgNPs, i/p route for 14th day (−); (D) Rats treated with Bio-AgNPs, i/p route for 28th day (−); (E) Rats treated with Bio-AgNPs, i/v route for 14th day (−); (F) Rats treated with Bio-AgNPs, i/v route for 28th day (−). *where (−) indicates no changes, (+) indicates mild changes, (++) indicates moderate changes, (+++) indicates severe changes.