
Figures & data
Scheme 1. (A): The stepwise synthesise procedure of Pt-LSSUs@PAA. (B) Schematic illustration of the electrochemical DNA bioassay protocol.
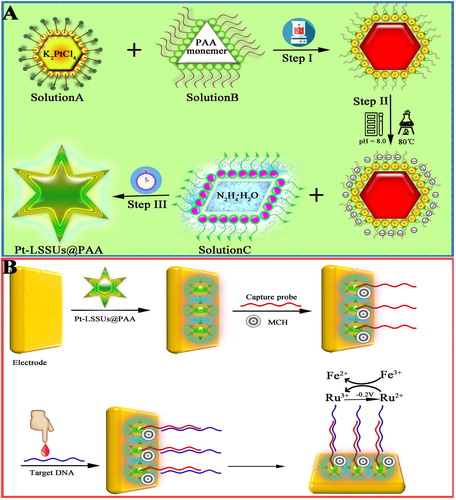
Table 1. Synthetic oligonucleotide sequences in this study.
Figure 1. (A) Typical FE-SEM and (B) TEM images of Pt-LSSUs@PAA nanostructures. (C) EDS of Pt-LSSUs@PAA nanosturctures. (D) EDX elemental mapping of Pt-LSSUs@PAA nanosturctures.
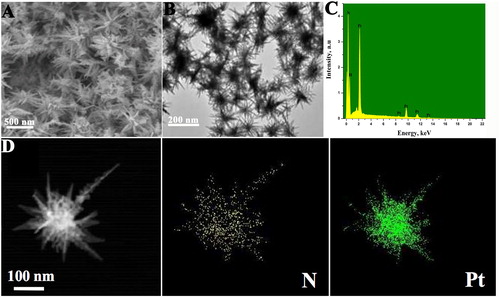
Figure 2. (A) CVs of (a) bare GCE, (b) GCE/Pt, and (c) GCE/Pt-LSSUs@PAA in 5 mM [Fe(CN)6]3−/4− containing a 0.1 M KCl solution. (B) Cyclic voltammograms of the modified electrode before (curve b) and after (curve c) hybridisation with target DNA in 5 mM [Fe(CN)6]3−/4− containing a 0.1 M KCl solution. (C) EIS for each immobilisation step in 5 mM [Fe(CN)6] 3−/4− containing a 0.1 M KCl solution: (a) bare GCE, (b) GCE/Pt-LSSUs@PAA, (c) GCE/Pt-LSSUs@PAA/PNA probe, (d) GCE/Pt-LSSUs@PAA/PNA probe/MCH (e) GCE/Pt-LSSUs@PAA/PNA probe/MCH/target DNA in 5 mM [Fe(CN)6]3−/4− containing a 0.1 M KCl solution.
![Figure 2. (A) CVs of (a) bare GCE, (b) GCE/Pt, and (c) GCE/Pt-LSSUs@PAA in 5 mM [Fe(CN)6]3−/4− containing a 0.1 M KCl solution. (B) Cyclic voltammograms of the modified electrode before (curve b) and after (curve c) hybridisation with target DNA in 5 mM [Fe(CN)6]3−/4− containing a 0.1 M KCl solution. (C) EIS for each immobilisation step in 5 mM [Fe(CN)6] 3−/4− containing a 0.1 M KCl solution: (a) bare GCE, (b) GCE/Pt-LSSUs@PAA, (c) GCE/Pt-LSSUs@PAA/PNA probe, (d) GCE/Pt-LSSUs@PAA/PNA probe/MCH (e) GCE/Pt-LSSUs@PAA/PNA probe/MCH/target DNA in 5 mM [Fe(CN)6]3−/4− containing a 0.1 M KCl solution.](/cms/asset/2f58c2f3-5c09-43d3-9ccb-612b012fa768/tjen_a_1559368_f0002_c.jpg)
Figure 3. Effects of (A) the concentration of Pt-LSSUs@PAA, (B) immobilisation time of PNA probe on the modified electrode and (C) incubation time.
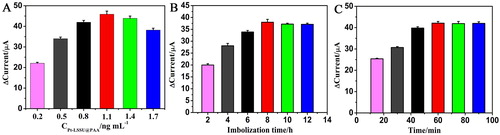
Figure 4. (A) DPV signals of the DNA sensors in the presence of different concentrations of COX-2 and (B) the calibration curve of the DNA sensors for 10 fM, 100 fM, 1 pM, 10 pM, 100 pM, 1 nM of COX-2 (n = 3). (C) Specific response of the DNA biosensor spiked with 50 nM glucose, 50 nM urea acid (UA), 50 nM ascorbic acid (AA), and after the biosensor was hybridised with complementary COX-2 (target DNA), single-base mismatch (Mismatch-1, wild type), two-base mismatch (mismatch-2), three-base mismatch (mismatch-3), non-complementary target (random) and blank sample (100 pM for each analyse). (D) The stability of the COX-2 DNA sensors (100 pM) after 3, 7, 10, 14, 21 and 28 days.
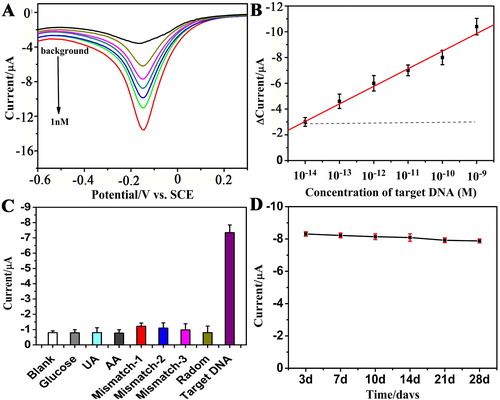
Table 2. Reproducibility of the electrochemical detection of COX-2.
Table 3. Recovery of COX-2 in human serum samples.
Table 4. Assay results of COX-2 gene in real serum sample that using the DNA sensor and the standard method.