Figures & data
Figure 1. Geometry of the 3 D printed collectors (Catia V5, measurements given in mm) and PCL/CF electrospun scaffolds on the 3 D printed collectors.
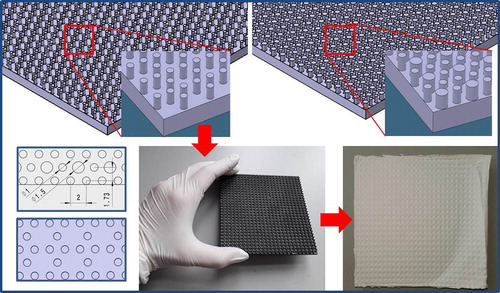
Table 1. Dimensions of the basic elements, in the hexagonal geometry of the 3 D printed collectors.
Figure 2. SEM images of the electrospun scaffolds: a) neat PCL, b) PCL/5% CFU1, c) PCL/10% CFU1, d) PCL/5% CFU2, e) PCL/10% CFU2, f) PCL/5% CFU3, g) PCL/10% CFU3, h) PCL/5% CFU4, i) PCL/10% CFU4.
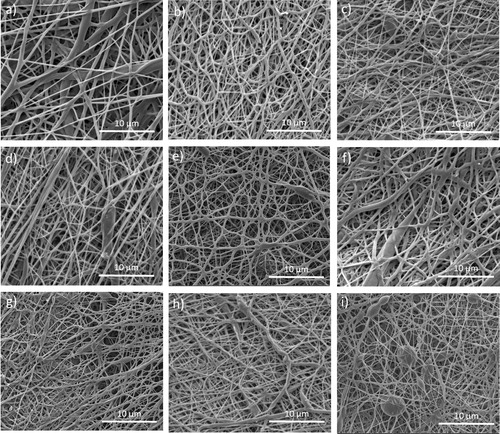
Figure 3. Fibers diameters (a) and pores area (b) distribution of the electrospun PCL/CFU scaffolds.
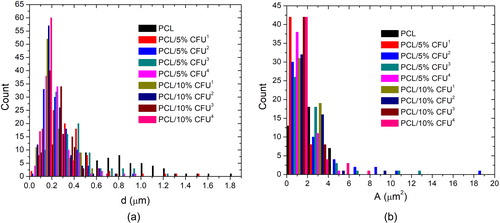
Table 2. Fibers diameter, pores area and electrospun materials total porosity.
Figure 4. DSC curves of the electrospun PCL/CFU scaffolds during heating (a) and cooling (b).
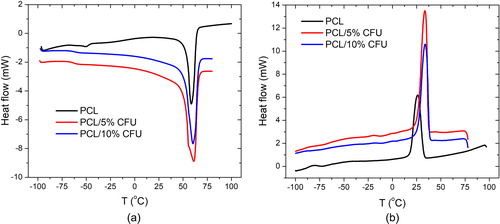
Table 3. Peak temperature of melting and crystallization, glass transition temperature and heat of melting and crystallization.
Figure 5. TGA (a) and DTG (b) curves of the electrospun PCL/CFU scaffolds.
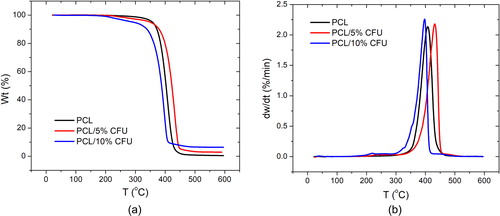
Table 4. Initial, final and maximum temperature and residue during degradation.
Figure 6. Tensile test behavior of the electrospun PCL/CFU scaffolds with 5 wt% (a) and 10 wt% (b) of the drug added.
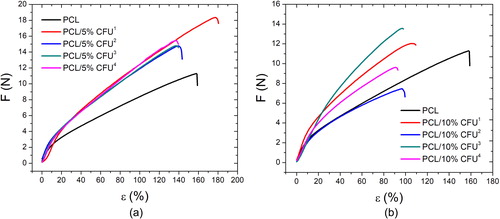
Table 5. Maximum force, elongation and tensile strength of the electrospun scaffolds.
Figure 7. HeLa cell seeding efficiency on two different electrospun scaffold types, six hours after seeding.
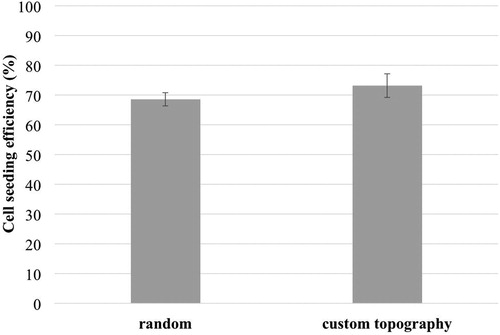
Figure 8. MTT staining of HeLa cells growing on two types of electrospun scaffolds 24 and 72 hours after cell seeding.
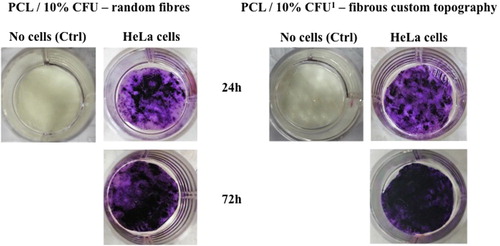
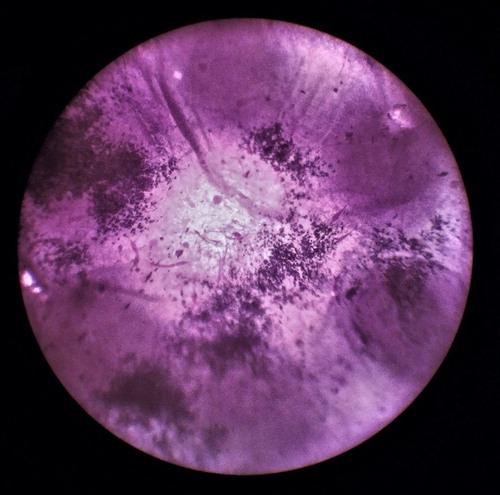
Figure 9. HeLa cells adhesion on the electrospun scaffolds with custom topography under optical microscopy.