Figures & data
Figure 1. XRD pattern of the as-prepared samples.
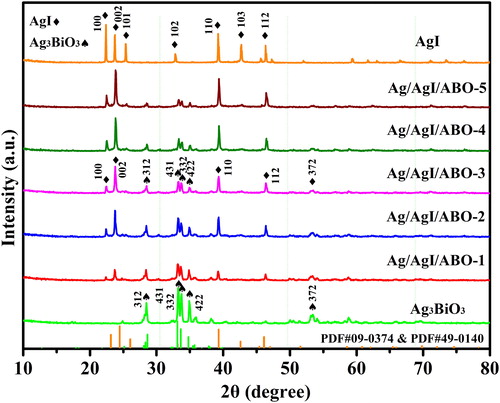
Figure 2. Survey XPS spectrum (a), high-resolution XPS spectrum of O 1s (b), I 3d (c), Bi 4f (d), and Ag 3d (e).
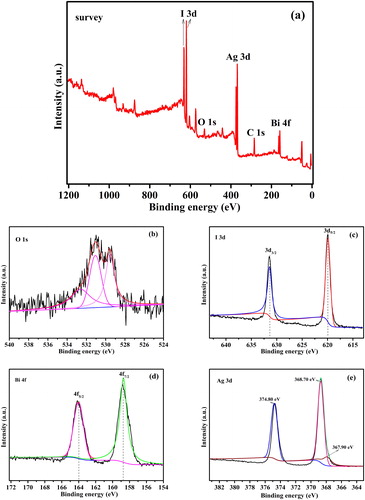
Figure 3. SEM patterns of Ag3BiO3 (a), AgI (b) and Ag/AgI/Ag3BiO3-3 (c).
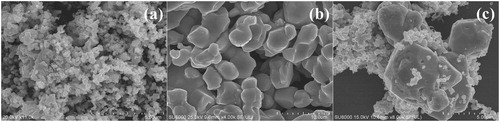
Figure 4. UV-vis DRS patterns of Ag3BiO3, AgI and Ag/AgI/Ag3BiO3 and the plots of F(R∞) for Ag3BiO3 and AgI (inset).
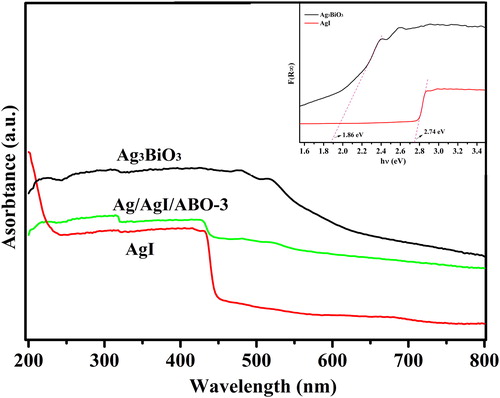
Figure 5. Photocatalytic activities of different samples for MB under visible-light irradiation (a), time-dependent UV-Vis absorption spectra for the degradations of MB over Ag/AgI/Ag3BiO3-3 catalyst (b), first-order rate constant of different as-obtained samples (c) and Change of TOC with irradiation time (d).
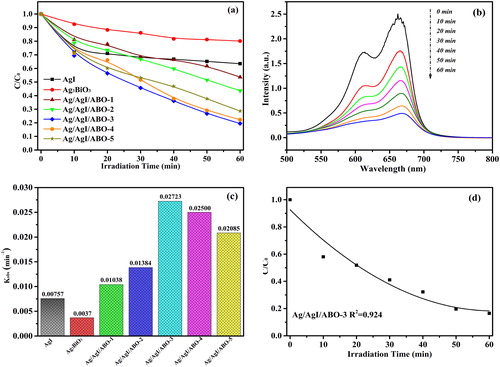
Figure 6. Photocatalytic degradation with different scavengers.
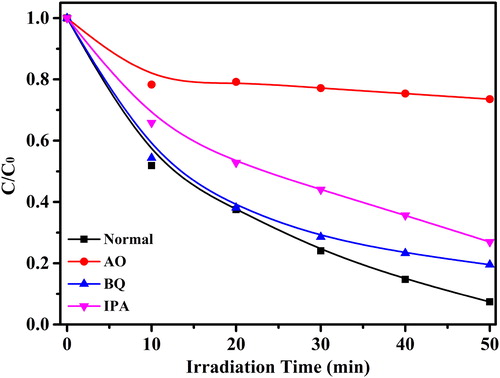
Figure 7. Schematic diagram of the proposed feasible photocatalytic mechanism.
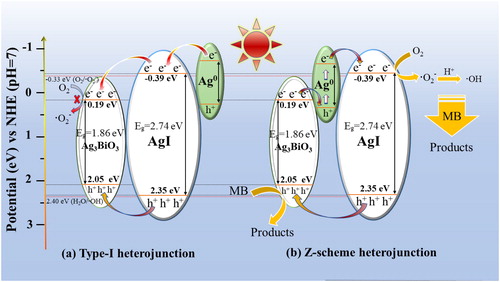
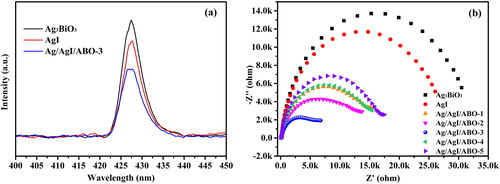
Figure 8. PL spectra (a) and EIS emission spectra (b) of as-prepared samples.