Figures & data
Figure 1. The specification of the photochemical reactor.
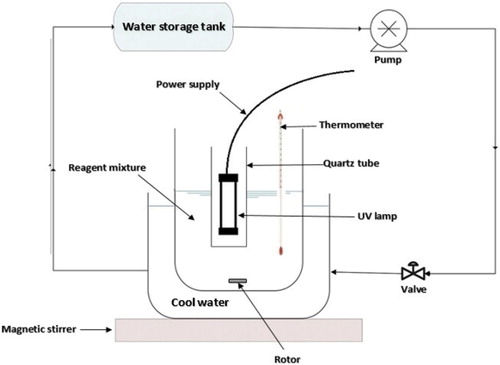
Table 1. The parameters and levels used for the experimental design.
Figure 2. The XRD pattern of synthesised TiO2 NPs. The most important peaks of rutile TiO2 have been marked by “*” on the figure.
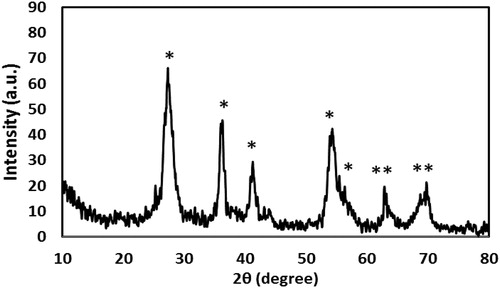
Figure 3. SEM image of TiO2 (a) and elemental analysis (EDX) for TiO2 (b).
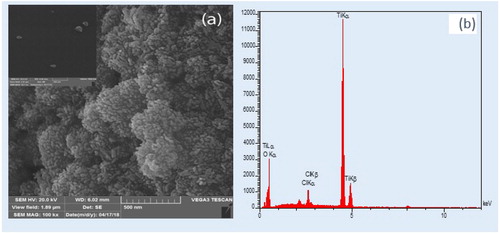
Table 2. Analysis of variance to evaluate the significance of the model obtained by CCD for alachlor removal.
Figure 4. Normal probability plot of the studentised residual (a) and alachlor removal observed in the experiment versus predicted values by the model (b).
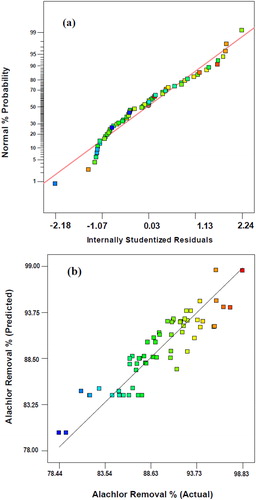
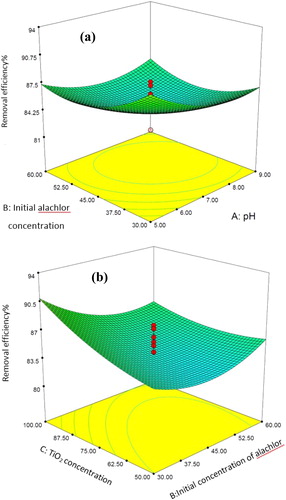
Figure 5. Response surface plot of the interactive effect of the initial alachlor concentration and pH on alachlor removal. Actual value of other factors: TiO2 concentration = 75.0 mg, temperature = 30.0 °C and time = 45.0 min. Response surface plot of the interactive effect of the initial alachlor concentration and TiO2 concentration on alachlor removal percentage. Actual values of other factors: pH = 7.0, temperature = 30.0 °C and time = 45.0 min.