Figures & data
Table 1. Complex1' s crystallographic parameters along with refinement details.
Figure 1. (a) 1's basic repetitive unit. (b) The one-dimensional chain-like network within 1. (c) 1's two-dimensional layered network. (d) 1's three-dimensional packing network showing the 1 D channels along the c axis.
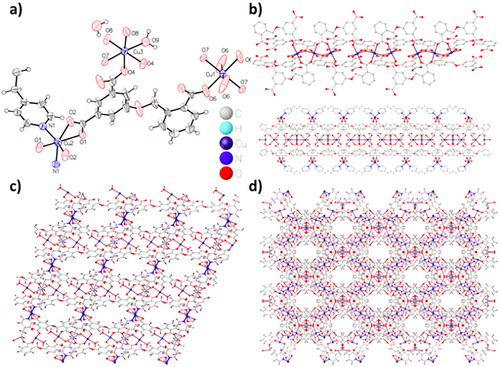
Figure 2. The PXRD patterns for 1.
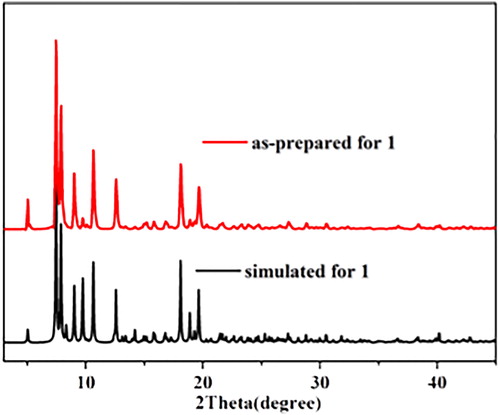
Figure 3. Nano 1' s SEM diagram.
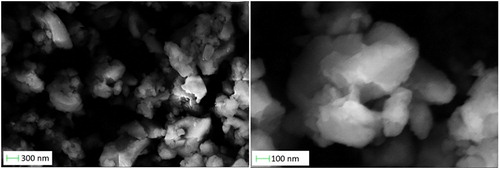
Figure 4. Reduced BT474 breast cancer cells survival rate after treating with nano 1. The BT474 breast cancer cells were treated by nano 1 of distinct consistence, cancer cells viability was measured via CCK-8 method and the IC50 value of nano 1 was calculated.
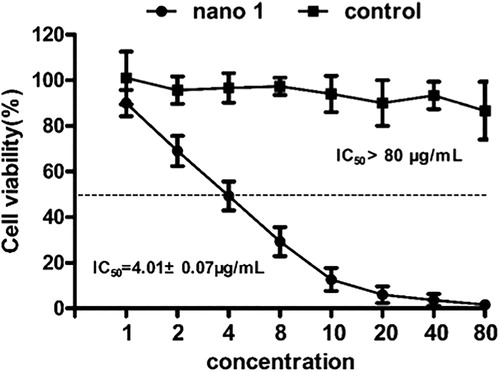
Figure 5. Increased percentage of the apoptotic BT474 breast cancer cell after nano 1 treatment. The BT474 breast cancer cell were inoculated into plates of 6 well and treated by 1 × IC50 as well as 3 × IC50. The apoptosis of cell was measured via Annexin V-FITC/PI method kit in flow cytometry at 488/525 and 625 mm. This experiment was performed at least three times.
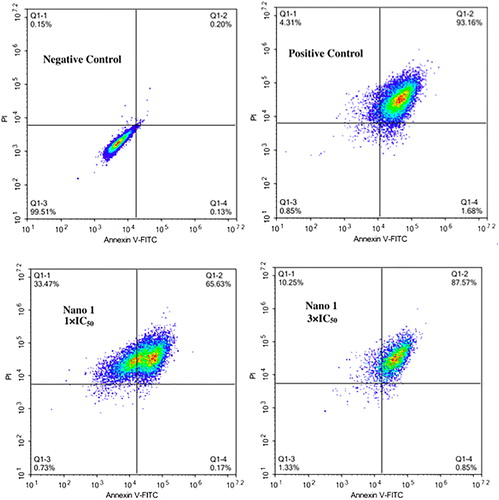
Figure 6. Increased ROS accumulation in the BT474 breast cancer cells after nano 1 treatment. The BT474 breast cancer cell were inoculated into plates of 6 well and treated by 1 × IC50 as well as 3 × IC50. The levels of ROS within the cancer cells were determined via DCFH-DA with fluorescence method.
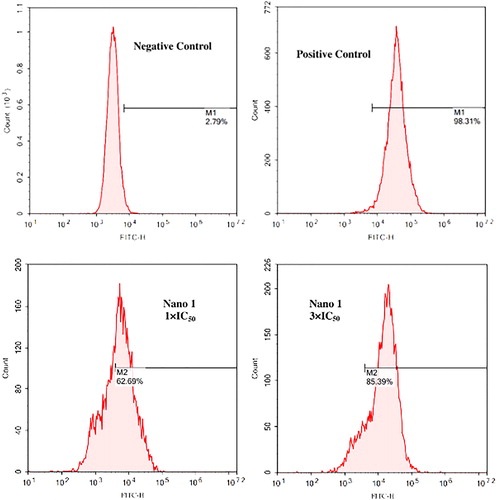
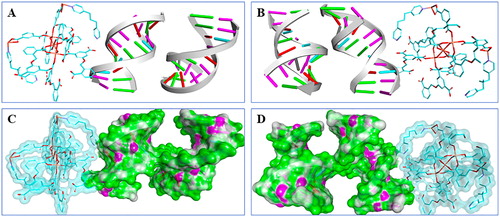
Figure 7. Predicted binding pattern of receptor DNA and synthesized compound. (A&B) Binding pattern holistic view reveals a direct binding potential for the compound to DNA. Compound was cyan rod-like and DNA banded. (C&D) The views of surface binding reveal that compound interacts with the DNA through its multiple functional group.