Figures & data
Figure 1. Schematic representation of papain mediated synthesis of gold nanoparticles and their ioconjugation with 5-fluorouracil (5-FU) so that 5-FU could be delivered through caveolae-mediated endocytosis to the nucleus of lung cancer cells.
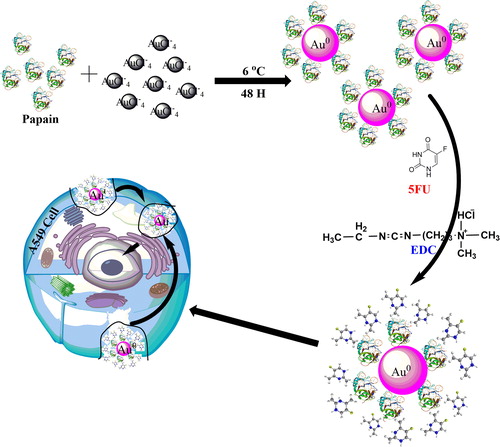
Figure 2. Characterisation of PpGNPs and 5F-PpGNPs under (A) UV–vis spectra, (B) dynamic light scattering (inset: 5F-PpGNPs), (C) transmission electron microscopy (inset: 5F-PpGNPs), (D) zeta potential (inset: 5F-PpGNPs).
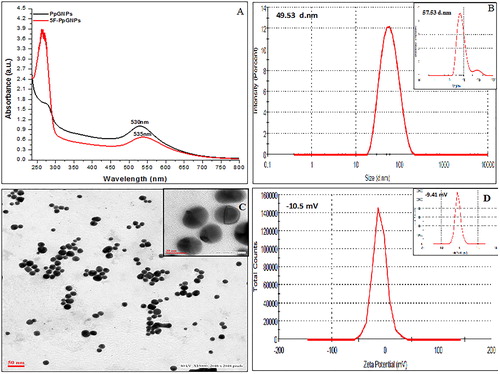
Figure 3. FTIR spectra of (A) GNPs encapsulated papain, (B) papain after bioconjugation of PpGNPs with 5FU and (C) UV–vis spectra of pure 5-FU.
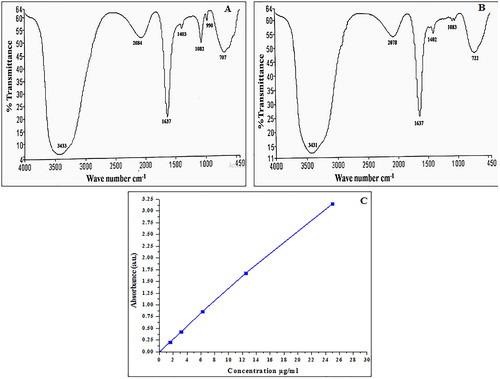
Figure 4. The cytotoxicity (dose-dependent) study of (A) PpGNPs (B) pure 5-FU and 5F-PpGNPs and (C) pure papain on A549 cells. All the data were expressed in mean ± SD of three experiments.
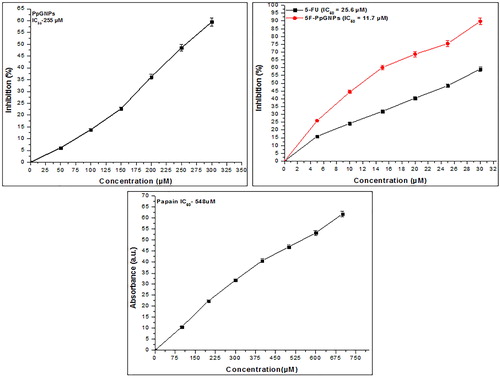
Figure 5. Image showing cytotoxic effect of (A) untreated control, (B) papain treated, (C) PpGNPs treated, (D) 5F-PpGNPs treated, and (E) 5-FU treated A549 cells at their respective IC50 concentrations at 20× magnifications.
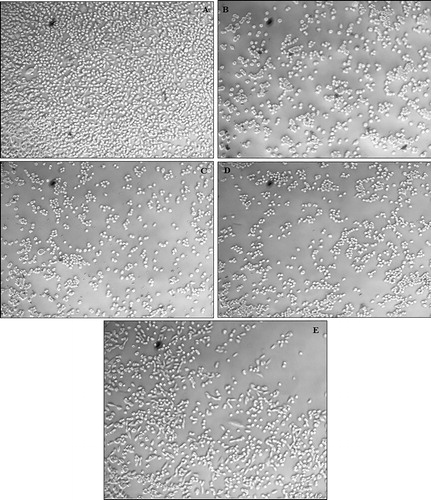
Figure 6. Mitochondrial depolarisation by disrupting mitochondrial membrane potential (ΔΨm) in A549 cells and images observed by staining with Mitotracker Red CMXROS. (A) Untreated control cells, (B) PpGNPs treated cells, (C) 5-FU treated cells, (D) 5F-PpGNPs treated cells. (E) Graph showing change in intensity of DCFDA stained control, PpGNPs, 5-FU and 5F-PpGNPs treated cells.
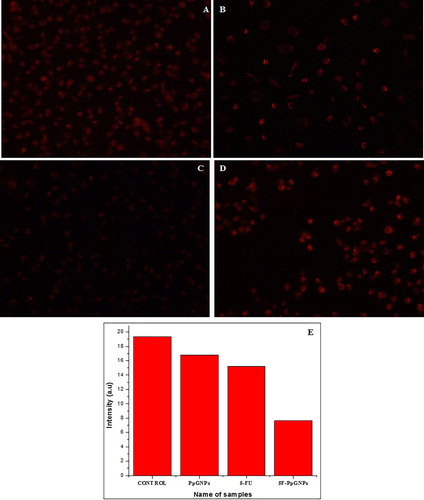
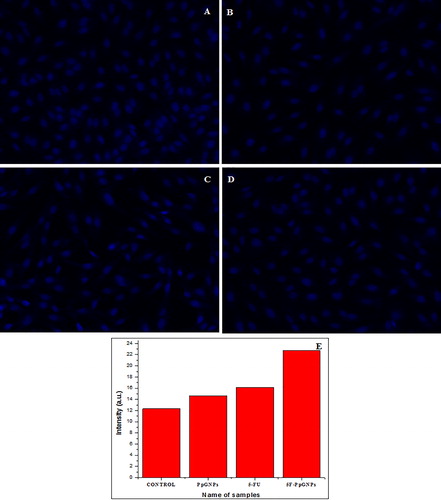
Figure 7. Images showing DCFDA staining under phase contrast microscope after 48 h of treatment on A549 cells at 20× magnification. (A) Control of DCFDA, (B) PpGNPs treated cells, (C) 5F-PpGNPs treated cells, (D) 5-FU treated cells. (E) Graph showing change in intensity of DCFDA stained control, PpGNPs, 5-FU and 5FPpGNPs treated cells.
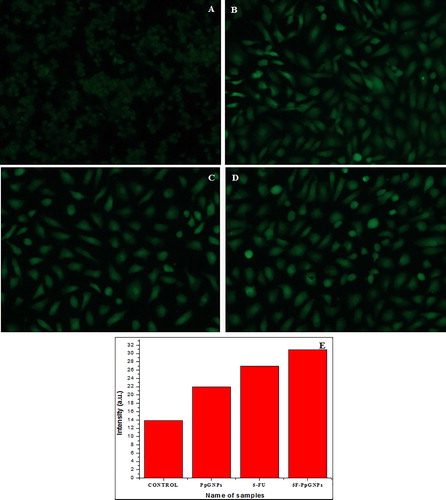
Figure 8. Images showing DAPI staining under phase contrast microscope after 48 h of treatment on A549 cells at 20× magnification. (A) Control of DAPI, (B) PpGNPs treated cells, (C) 5F-PpGNPs treated cells, (D) 5-FU treated cells. (E) Graph showing change in intensity of DAPI stained control, PpGNPs, 5-FU and 5FPpGNPs treated cells.