
Figures & data
Figure 1. The procedure of dopamine detection.
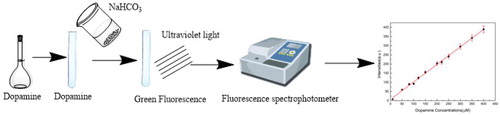
Figure 2. The schematic diagram of dopamine detection.
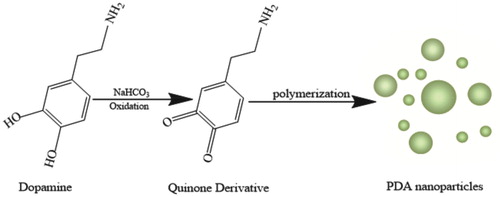
Figure 3. Fluorescence spectra of test solution at different times (CDA: 130 μM).
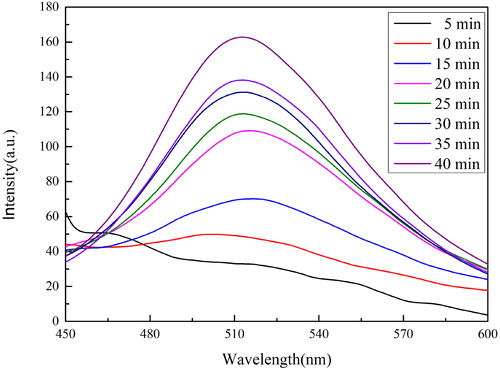
Figure 4. Fluorescence spectra of the test solutions with different DA concentrations at the same test condition.
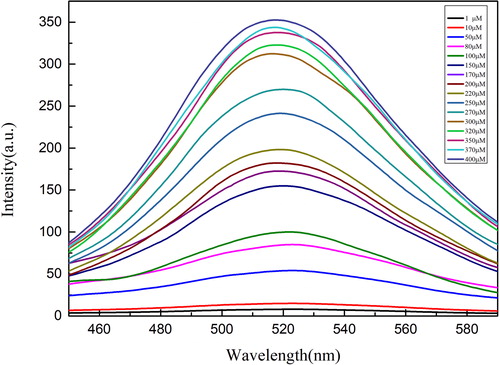
Figure 5. Linear relationship between dopamine concentrations and fluorescence intensities.
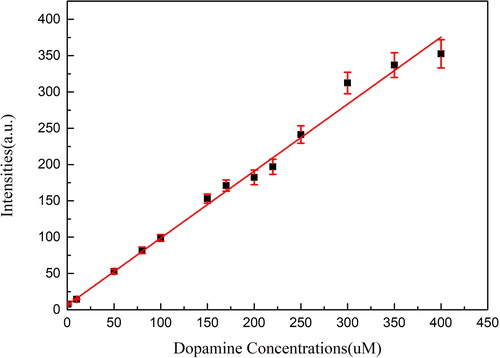
Table 1. Comparison between present method and literature.
Figure 6. The fluorescence intensities of DA test solution and other test solutions with different chemicals. (DA concentration was 10 μM and the concentrations of other substances were both100 μM. DA MIX, mixture of all interfering chemicals; UA, uric acid; AA, ascorbic acid; Asp, aspartic acid; Lys, lysine; Glc, glucose; Suc, sucrose).
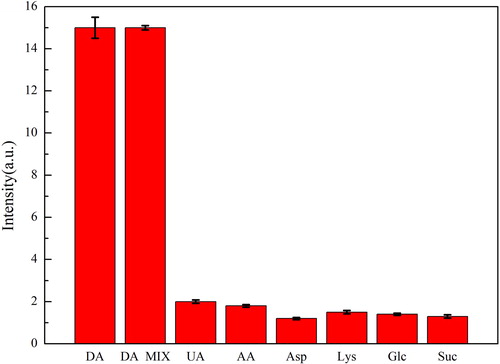
Table 2. Recovery of DA in serum samples with different additions of DA (n = 5).