
Figures & data
Figure 1. Powder X-ray diffraction of SnO2 (a) and WO3 (b) nano adsorbent.
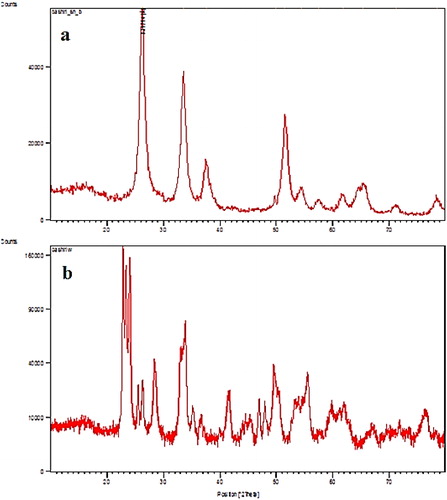
Figure 2. Energy Dispersive X-Ray (EDX) spectrum of SnO2 (a) and WO3 (b) nano adsorbent.
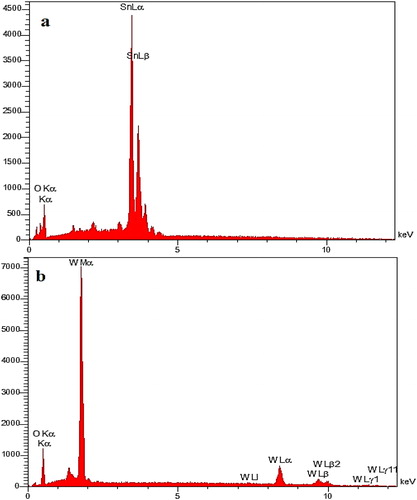
Figure 3. FTIR spectrum of SnO2 (a) and WO3 (b) nano adsorbent.
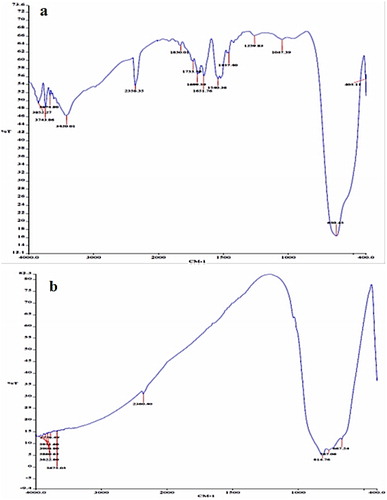
Figure 4. SEM image of SnO2 (a) and WO3 (b) nano adsorbent.
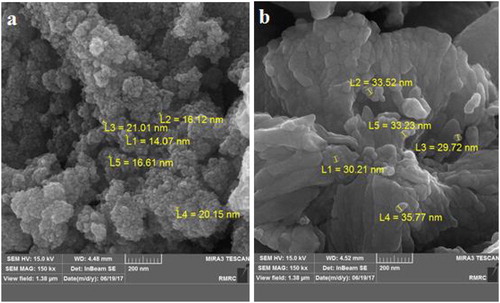
Figure 5. Effect of initial pH on phosphate removal (initial concentration of phosphate, 50 mg L−1;absorbent dosage, 0.025 g L−1; contact time, 24 h; Temperature, 25 °C).
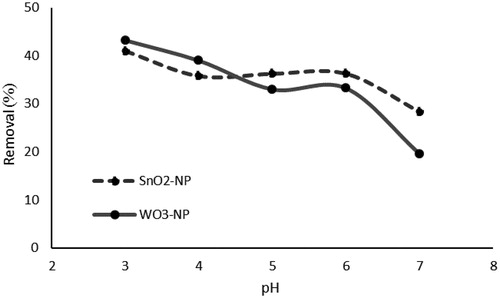
Figure 6. Effect of adsorbent dosage on phosphate removal (initial concentration of phosphate, 50 mg L−1; contact time, 24 h; Temperature, 25 °C).
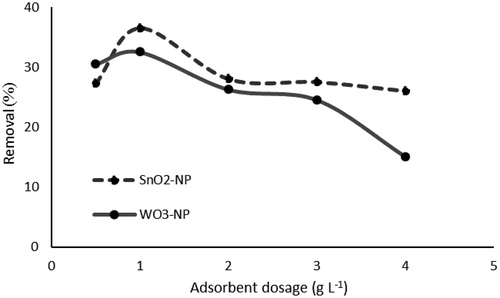
Figure 7. Effect of contact time on phosphate removal (initial concentration of phosphate, 50 mg L−1; absorbent dosage, 1g L−1; Temperature, 25 °C).
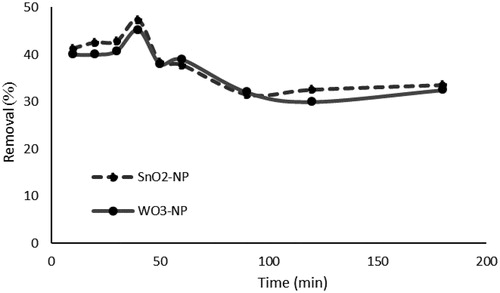
Table 1. Kinetic parameters for the adsorption of phosphate onto nano adsorbent.
Table 2. Maximum adsorption capacities of phosphorus onto various adsorbents.
Figure 8. Freundlich isotherm model of phosphate adsorption (pH, 3; adsorbent dosage, 1 g L−1; contact time, 40 min; Temperature, 15 °C).
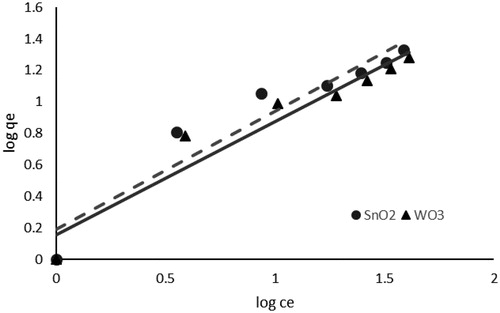
Table 3. Freundlich isotherm constants for the adsorption of phosphate onto nano adsorbent.
Figure 9. SEM image after adsorption isotherm of SnO2 (a) and WO3 (b) nano adsorbent (initial concentration of phosphate, 60 mg L−1).
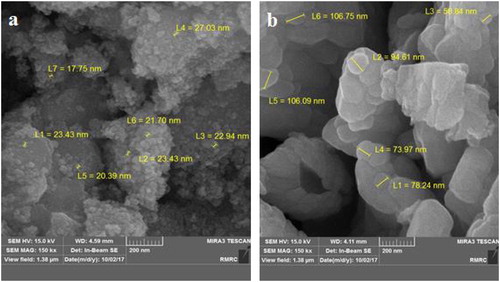
Figure 10. Energy Dispersive X-Ray (EDX) spectrum after adsorption isotherm of SnO2 (a) and WO3 (b) nano adsorbent (initial concentration of phosphate, 60 mg L−1).
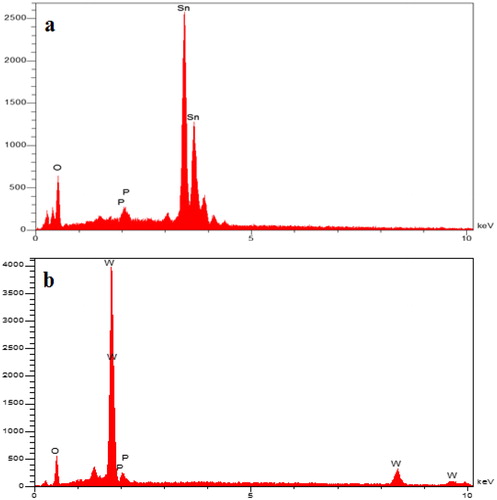
Figure 11. Desorption of phosphate from nano adsorbent using CaCl2 0.01 M.
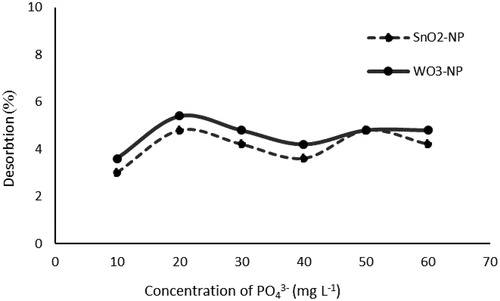
Figure 12. Effect of coexisting anions on phosphate adsorption by SnO2 nano adsorbent.
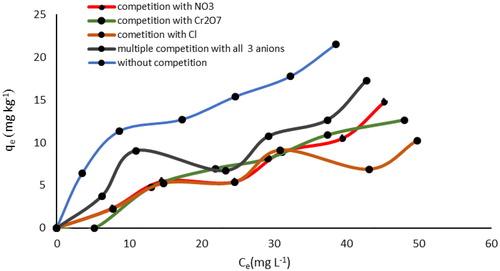
Figure 13. Effect of coexisting anions on phosphate adsorption by WO3 nano adsorbent.
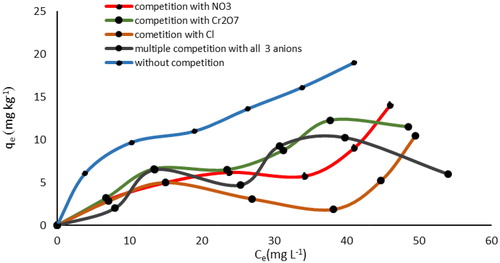
Figure 14. SEM image of SnO2 (a) and WO3 (b) nano adsorbent with coexisting of Cl− anion.
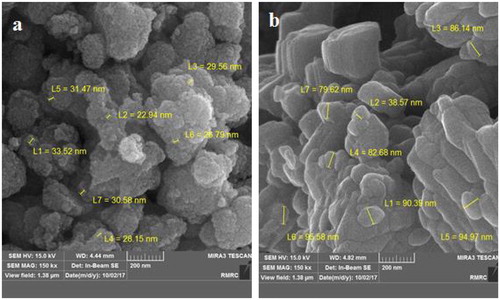
Figure 15. SEM image of SnO2 (a) and WO3 (b) nano adsorbent with coexisting Cl−, Cr2O7– and NO3− anions.
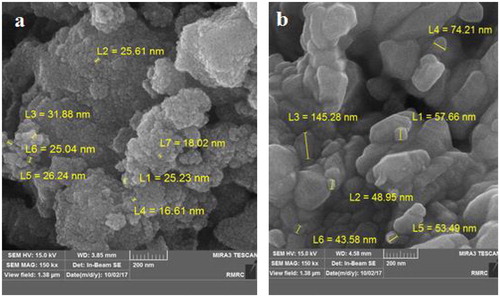
Figure 16. EDX spectrum of SnO2 (a) and WO3 (b) nano adsorbent with coexisting of Cl− anion.
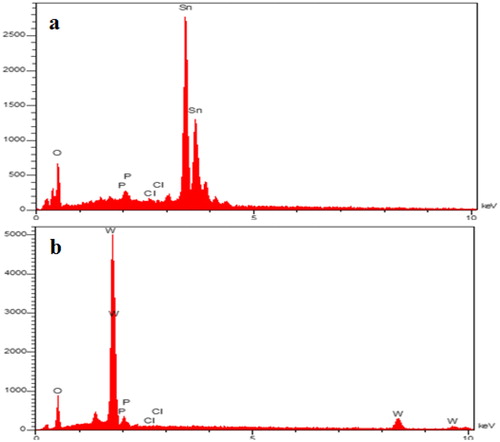
Figure 17. EDX spectrum of SnO2 (a) and WO3 (b) nano adsorbent with coexisting Cl−, Cr2O7− and NO3- anions.
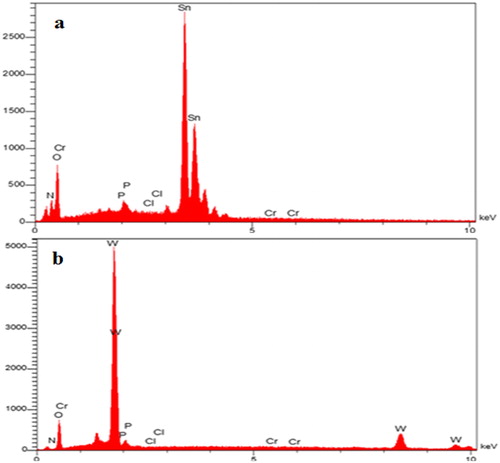
Figure 18. Effect of temperature on phosphorus removal (initial concentration of phosphate, 50 mg L−11; absorbent dosage, 1g L−1; pH, 3; time, 40 min).
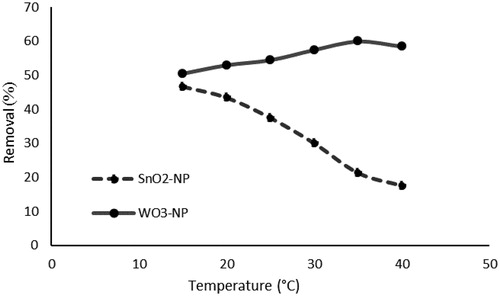
Table 4. Thermodynamic parameters for adsorption of phosphate onto nano adsorbent.