Figures & data
Figure 1. The schematic of lateral flow strip.
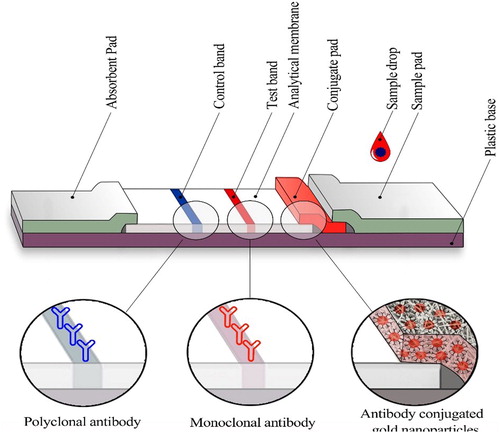
Figure 2. Characterisation of gold nanoparticles after synthesis. a) UV-Vis spectra of bare AuNP and antibody conjugated AuNP (14 ± 2 nm AuNP), b) UV-Vis spectra of bare AuNP and antibody conjugated AuNP (35 ± 3 nm AuNP).
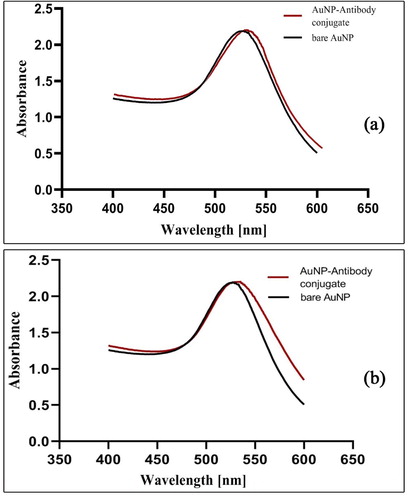
Figure 3. Dynamic light scattering spectrum of bare AuNP and AuNP -Antibody, a) DLS spectrum of bare AuNP and antibody conjugated AuNP (14 ± 2 nm AuNP), b) DLS spectrum of bare AuNP and antibody conjugated AuNP (35 ± 3 nm AuNP).
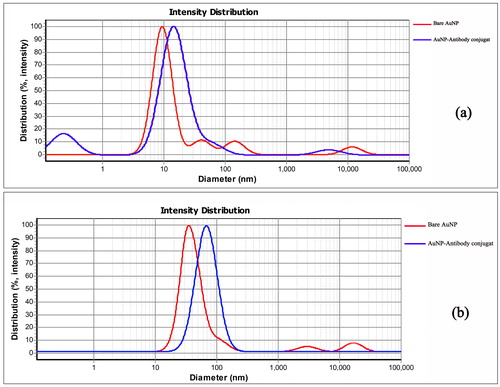
Figure 4. TEM images of naked AuNP with different sizes, A) 35 ± 3 nm B) 14 ± 2 nm.
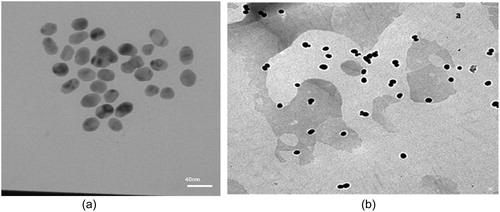
Figure 5. Optimal pH value and Ab concentration for coating AuNP.
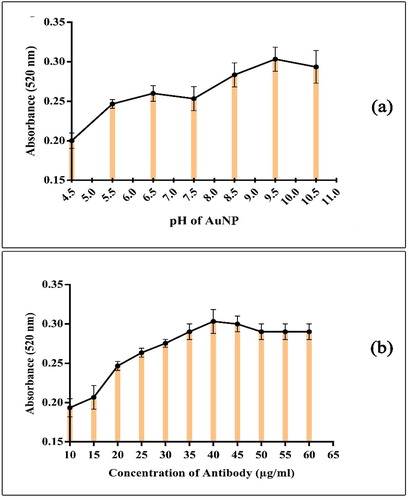
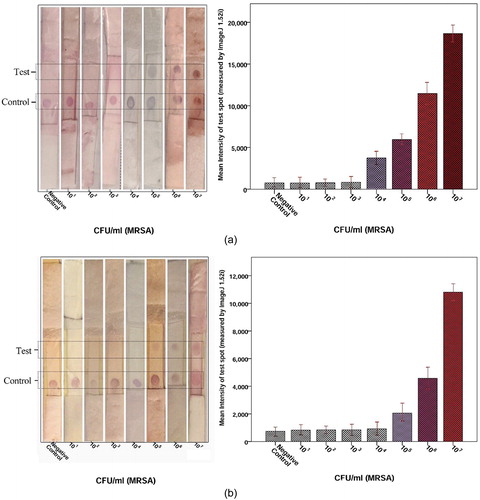
Figure 6. Determination of the detection limit of LFIA strips (A) AuNP (14 ± 2 nm AuNP), (B) AuNP (35 ± 3 nm AuNP). Image analysis of the LFIA strip showed that the first significant signal at MRSA concentrations was 104 cfu/ml for 14 ± 2 nm AuNP and 105 cfu/ml for 35 ± 3 nm AuNP. In this LFIA technique, two red band in the test and control regions indicates a positive result. But a red band in the control region indicate a negative result.