Figures & data
Figure 1. FT-IR spectral analysis of (a) aqueous rhizome extract of G. superba and (b) biosynthesised nanotitania catalysts using G. superba rhizome extract.
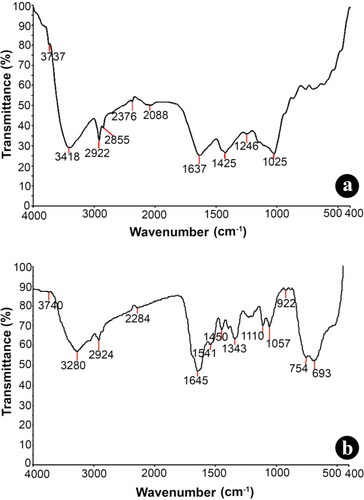
Figure 2. XRD pattern of biosynthesised nanotitania catalysts using rhizome extracts of G. superba exhibiting the facets of crystalline nature.
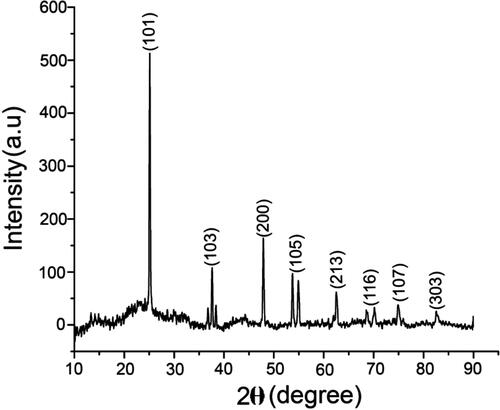
Figure 3. (a) FESEM images of synthesised nanotitania catalysts using rhizome extracts of G. superba confirming the spherical shaped nanocrystals. (b) Energy dispersive X-ray (EDX) spectrum of TiO2 NPs displayed the strong striking of titanium ions.
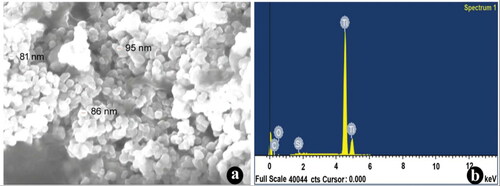
Figure 4. Antibacterial efficacy of synthesised nanotitania catalysts synthesised using aqueous rhizome extracts of G. superba against (a) S. aureus, (b) S. epidermidis, (c) P. aeruginosa, (d) P. vulgaris, (e) K. pneumoniae and (f) E. coli.
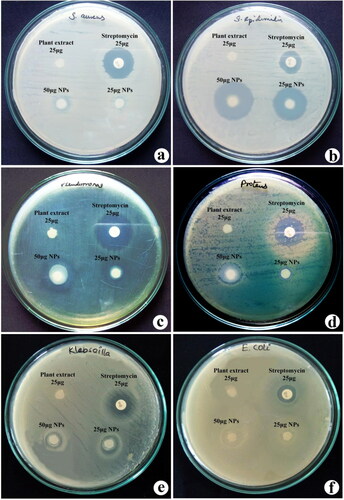
Table 1. Effect of different doses of nanotitania catalysts and rhizome extract of G. superba on anti-biofilm activity in S. epidermidis and P. aeruginosa.
Figure 5. MTT assay confirming the cytotoxic effects of G. superba rhizome extract (GSRE) and TiO2 NPs (GS-TiO2 NPs) catalysts (a) MCF-7 cells, (b) Normal mouse fibroblast (L929) cell line for 48 h. Data are expressed as mean ± SD (three replicates).
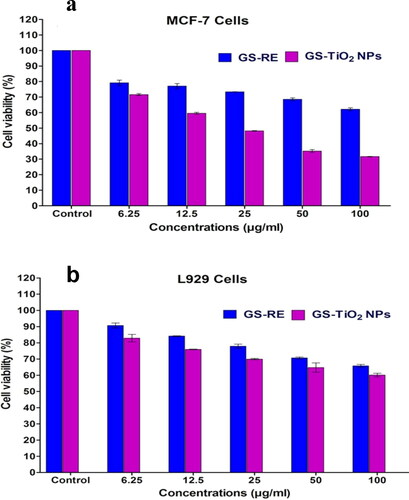
Figure 6. Fluorescence microscopy images of AO/EtBr stained individual control and nanotitania catalysts treated MCF-7 cells, (a) control (untreated) cells, (b) G. superba rhizome extract and (c) nanotitania catalysts treated cells. The arrows are denoted by green colour (live cells), orange colour (proapoptotic cells) and red colour (dead cells). Hoechst nuclear staining images of control cells (d) and arrows indicate nuclear materials in apoptotic cells (e, f). The white scale bars are 10 µm.
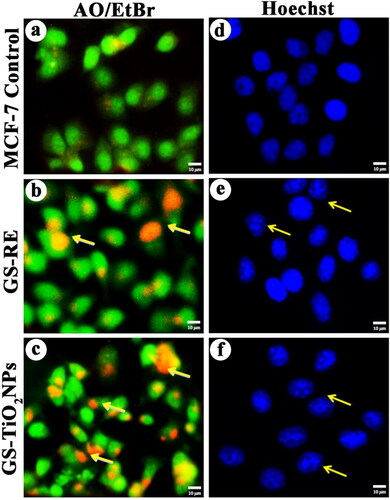
Figure 7. Effects of G. superba rhizome extract and nanotitania catalysts (IC50 concentration) on intracellular ROS generation in treated MCF-7 cells, (a) Control cells, (b, c) rhizome extract and nanotitania catalysts treated cells. Rhodamine mitochondrial staining images of (d) control cells, (e, f) Rhizome extract and nanotitania catalysts exposed cells showed compressed form of mitochondrial membrane The white scale bars are 10 µm.
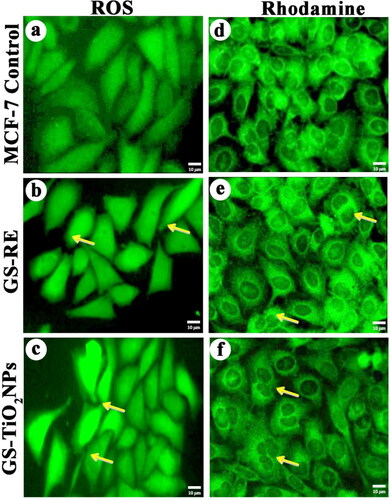
Figure 8. (a) DNA damage in MCF-7 cells, (b) control cells, G. superba rhizome extract and nanotitania catalysts treated cells (IC50 concentration). The scale bars are 10 µm.
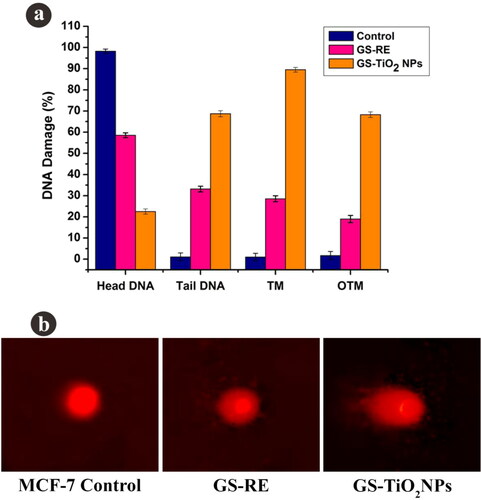
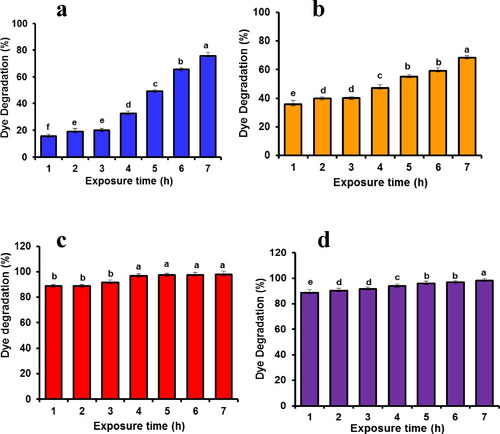
Figure 9. Photocatalytic degradation activity of biomolecule-coated nanotitania catalysts synthesised using aqueous rhizome extracts of G. superba against (a) methylene blue, (b) methyl orange, (c) alizarin red and (d) crystal violet.