
Figures & data
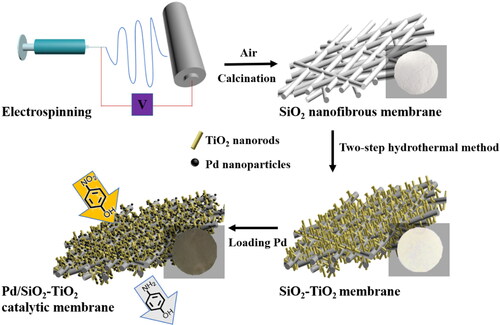
Scheme 1. Schematic illustration of fabrication process of Pd/SiO2-TiO2 membranes.
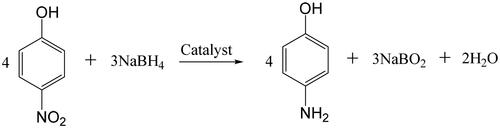
Scheme 2. Reduction of p-nitrophenol to p-aminophenol with NaBH4.
Scheme 3. Schematic illustration of the flow through catalytic membrane reactor system.
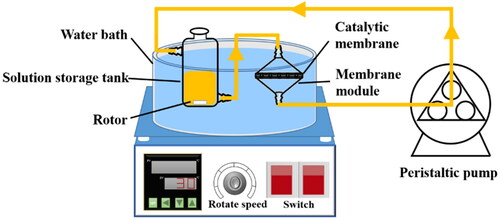
Figure 1. XRD patterns of (a) Pd/SiO2-TiO2-0, (b) Pd/SiO2-TiO2-0.05, (c) Pd/SiO2-TiO2-0.2, (d) Pd/SiO2-TiO2-0.5.
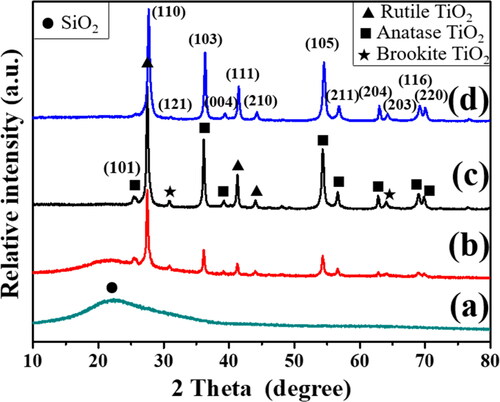
Figure 2. FESEM images of (a) Pd/SiO2-TiO2-0, (b) Pd/SiO2-TiO2-0.05, (c) Pd/SiO2-TiO2-0.2, (d) Pd/SiO2-TiO2-0.5 with low magnification.
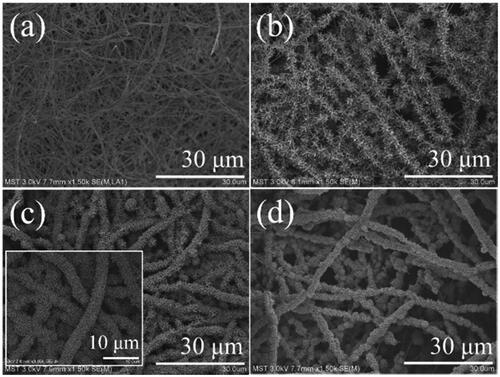
Figure 3. EDS analysis of the catalytic membranes: (a) Pd/SiO2-TiO2-0.05, (b) Pd/SiO2-TiO2-0.2, (c) Pd/SiO2-TiO2-0.5.
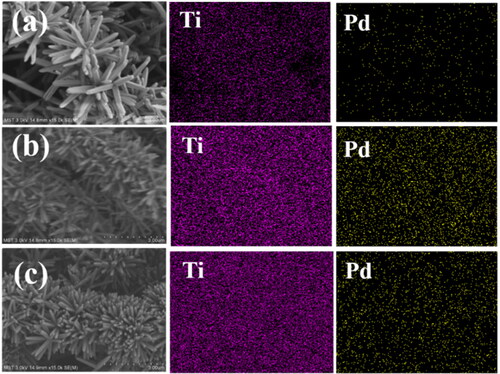
Table 1. Pd content and BET analysis of the catalytic membranes.
Figure 4. TEM images of (a, c) Pd/SiO2-TiO2-0, (b, d, e) Pd/SiO2-TiO2-0.2.
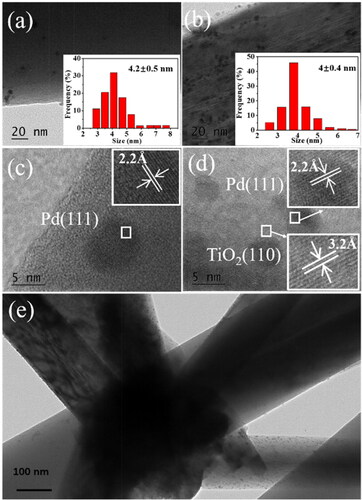
Figure 5. XPS survey spectra of the powder taken from (a) Pd/SiO2-TiO2-0, (b) Pd/SiO2-TiO2-0.2. The inset is the table of atomic concentration of elements in the catalytic membranes.
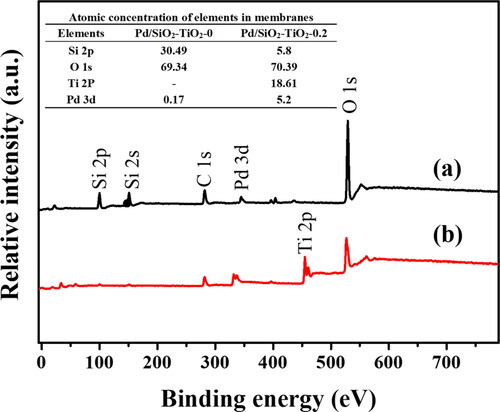
Figure 6. Pd 3d XPS spectra of the powder taken from (a) Pd/SiO2-TiO2-0, (b) Pd/SiO2-TiO2-0.2.
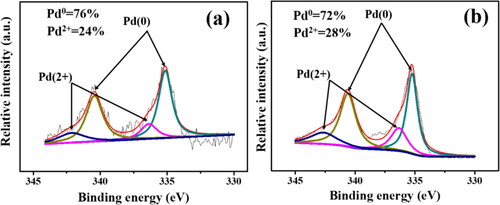
Figure 7. Basic properties of the catalytic membranes: (a) pure water permeability and porosity, (b) pore size distribution.
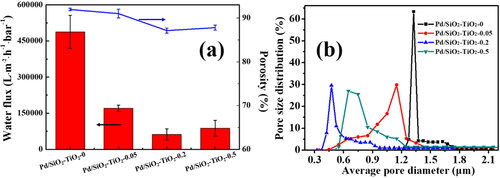
Figure 8. Tensile stress-strain curves of the catalytic membranes (a), optical images of the catalytic membranes: they can be stretched and folded without damage (b–d).
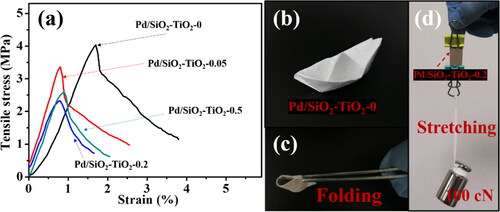
Figure 9. Catalytic activities of the Pd/SiO2-TiO2 catalytic membranes in the hydrogenation of PNP (PNP concentration 12 mM, molar ratio of NaBH4 to PNP 12.5, temperature 30 °C, rotation rate 30 rpm).
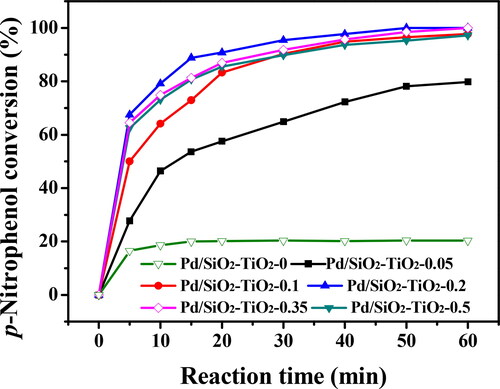
Figure 10. Effects of the reaction conditions on the initial reaction rate: (a) rotation rate of pump, (b) PNP concentration, (c) NaBH4 concentration, and (d) reaction temperature.
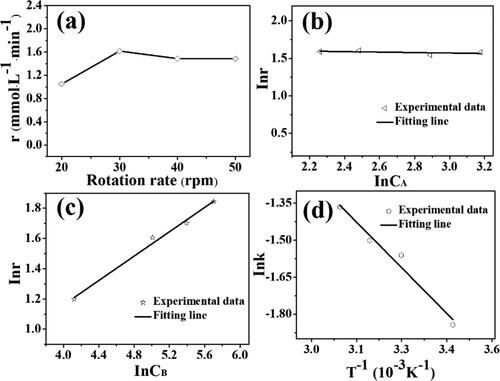
Figure 11. Stability of gravity-driven nanofibrous catalytic membrane reactor: (a) reduction efficiency of PNP over Pd/SiO2-TiO2-0.2, the inset is the membrane reactor device driven by gravity; (b) FESEM image of Pd/SiO2-TiO2-0.2 after continuous reaction (Reaction conditions: PNP concentration 1.2 mM, molar ratio of NaBH4 to PNP 50, temperature 25 °C, residence time 3.3 s, permeation flux 153 L·m−2·h−1); and (c, d) reduction efficiency of Pd/SiO2-TiO2-0.2 for o-nitrophenol (ONP) and m-nitrophenol (MNP), the inset shows the change of the reaction solution.
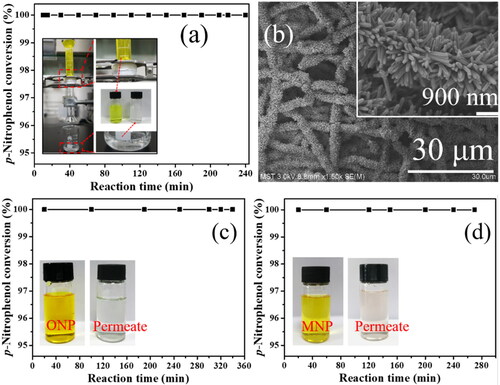
Figure 12. Proposed mechanism for the reduction of PNP over Pd/SiO2-TiO2.
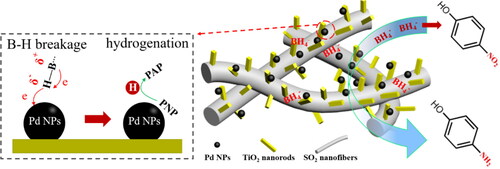
Table 2. Comparison of p-nitrophenol reduction by catalytic membranes.