Figures & data
Figure 1. Barium titanate nanocubes. (A) Monodispersed cubic particles can be seen in the TEM images. (B) Size distribution of 200 measured particles with an average width of 13 ± 2 nm.
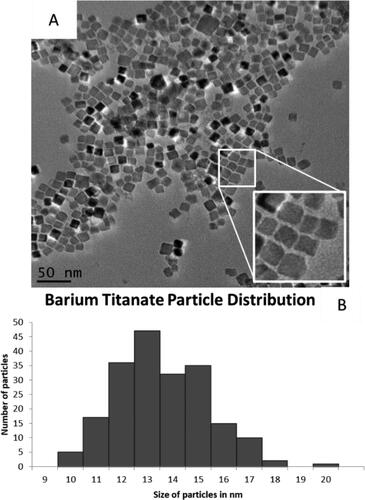
Table 1. The different ratios of oleylamine versus oleic acid that were used when designing a compatible barium titanate particle for hexaniobate nanoscrolls.
Table 2. All the major synthetic routes that were taken when optimising the formation of BaTiO3@hexaniobate nanopeapods. The final reaction, Reaction 14, was the best, producing the most encapsulation.
Figure 2. Figure showing the effects of stirring before heating when synthesising BaTiO3@hexaniobate nanopeapods. (A) Reaction 10, sample was only stirred for 5 min with barium titanate particles introduced. (B) Reaction 13, sample was stirred for 1 h with particles introduced. (C) Sample with stirred for 1 h without the particles added. After the 1-h time passed, sonicated particles were added in before heating occurred.
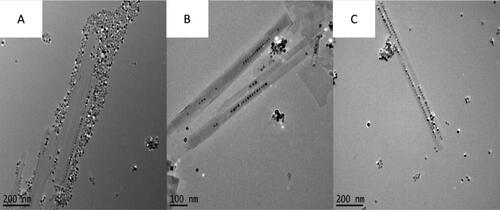
Figure 3. BaTiO3 nanopeapods made using the optimal synthetic pathway (, Reaction 14). Left. Image of four adjacent nanopeapods. Right. Higher magnification image shows scroll layer spacing, interparticle distance and a typical size of nanoparticles located within the hexaniobate nanoscroll.
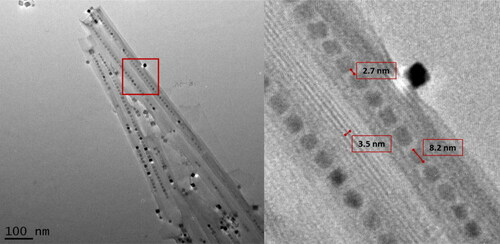
Figure 4. Additional BaTiO3@hexaniobate samples. (A) The capture of larger BaTiO3 particles. (B) An exceptionally long (> 1 μm) NPP is observed. (C) Two rows of encapsulated BaTiO3 nanoparticles can be seen in the centre of the nanoscroll.
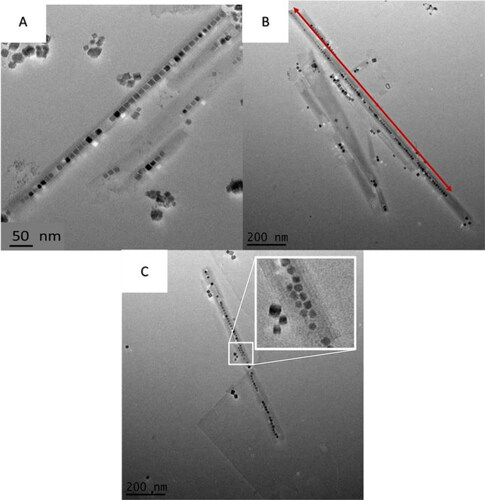
Figure 5. Overall statistics obtained from NPPs produced after successful replication of synthesis (Reaction 14 from ). Average particle size located within the scrolls was 10 ± 2 nm with an average of 27 ± 14 particles encapsulated. These particles also had an average spacing of 2.7 ± 0.7 nm.
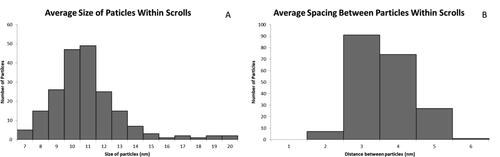
Figure 6. Filling fractions of the BaTiO3@HNB NPPs with 150 NPPs considered. Calculations based on the volume occupied by particles inside scrolls.
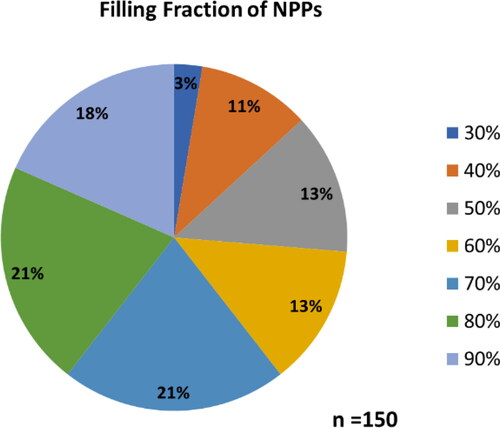
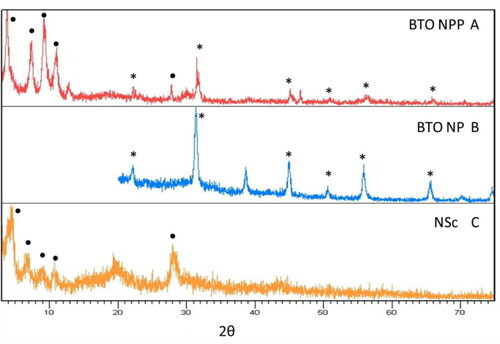
Figure 7. Observed XRD patterns of the (A) synthesised BaTiO3@hexaniobate nanopeapods, (B) barium titanate nanoparticles (*) that were used in the synthesis and (C) observed pattern of potassium hexaniobate scrolls (●) alone. A slight zero-shift in the data is attributed to sample displacement.