
Figures & data
Figure 1. FTIR spectra of free temozolomide, free cabergoline, FOL-DUAL-ILs, FOL-DUAL-DLs, UN-DUAL-DLs and FOLATE-DSPE conjugate.
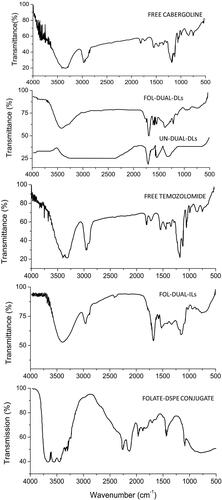
Table 1. Size distribution, polydispersity index (PDI) and Zeta potential of the liposomal formulations.
Table 2. EE (%) for temozolomide and cabergoline in the liposomal formulations.
Figure 2. Phase contrast microscopy images: 2A FOL-DUAL-ILs; 2B FOL-DUAL-DLs; 2C UN-DUAL-DLs.
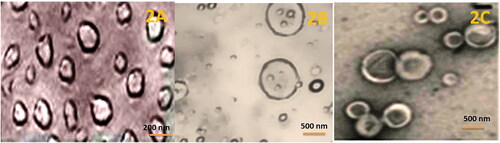
Figure 3. CRYO-TEM microscopy images: 3 A FOL-DUAL-ILs; 3B FOL-DUAL-DLs; 3C UN-DUAL-DLs.
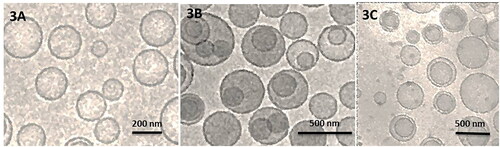
Table 3. Size, zeta potential and PDI of FOL-DUAL-ILs, FOL-DUAL-DLs and UN-DUAL-DLs after 10, 20 & 30 days during stability studies.
Figure 4. In vitro release studies of temozolomide and cabergoline respectively 4 A & 4B pH 7.4 (normal physiological milieu) 4 C & 4 D pH 5.0 (tumor milieu).
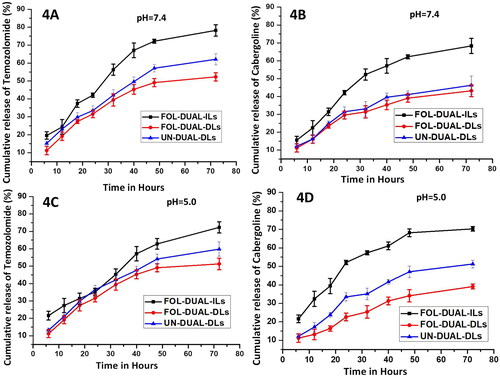
Table 4. Haematological parameters observed in rats post intravenous inject of the free drugs, mixture and liposomal formulations.
Figure 5. Qualitative uptakes of the free drugs and liposomal formulations by primary cell cultures 5 A free temozolomide; 5B free cabergoline; 5 C cabergoline and temozolomide mixture; 5 D FOL-DUAL-ILs; 5E FOL-DUAL-DLs; 5 F UN-DUAL-DLs.
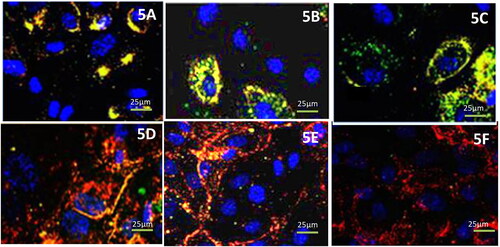
Figure 6. Quantitative uptake was elaborated by FACS assay of free drugs and liposomal formulations by primary cell cultures.
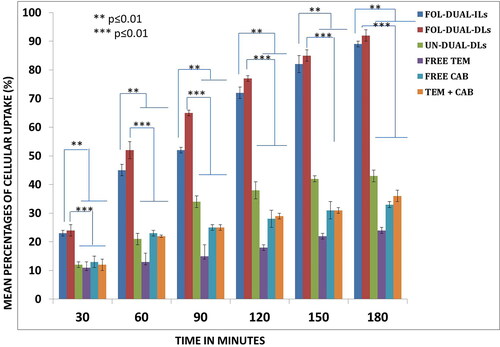
Figure 7. % Cellular viability on being treated with FOL-DUAL-DLs, FOL-DUAL-ILs, UN-DUAL-DLs, PBS (control), free temozolomide, free cabergoline and temozolomide-cabergoline mixture.
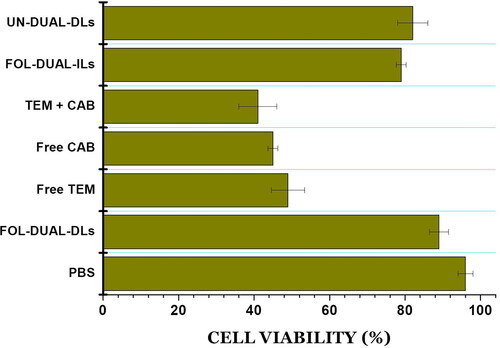
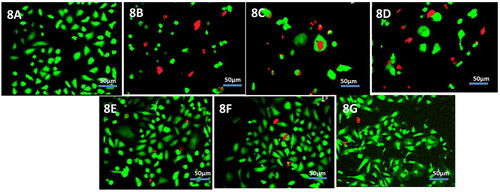
Figure 8. Cellular viability on being treated with the following formulations 8 A. PBS (control); 8B. temozolomide-cabergoline mixture; 8 C. Free temozolomide; 8 D. Free cabergoline; 8E. FOL-DUAL-DLs; 8 F. FOL-DUAL-ILs; 8 G. UN-DUAL-DLs,).
Data availability statement
All data generated or analysed during this study are included in this submitted article. The raw data shall be made available upon request to the corresponding author.