
Figures & data
Figure 1. Molecular structure of Olanzapinium 2,5-dihydroxybenzoate.
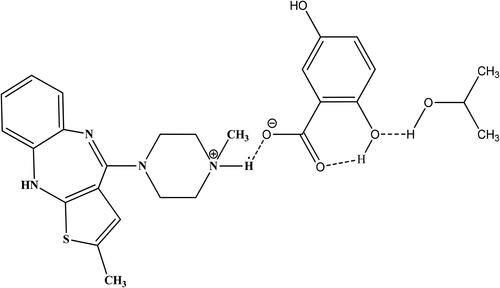
Figure 2. 1H-NMR spectrum of Olanzapinium 2,5-dihydroxybenzoate in CDCl3.
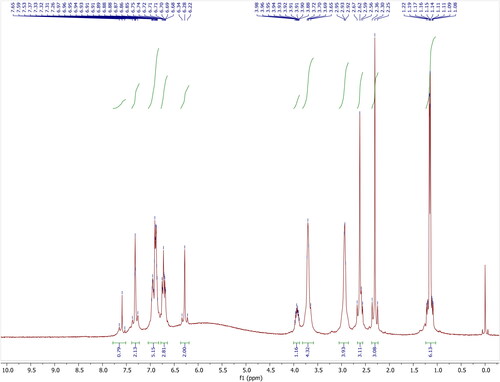
Figure 3. 13C-NMR spectrum of Olanzapinium 2,5-dihydroxybenzoate in CDCl3+DMSO-d6.
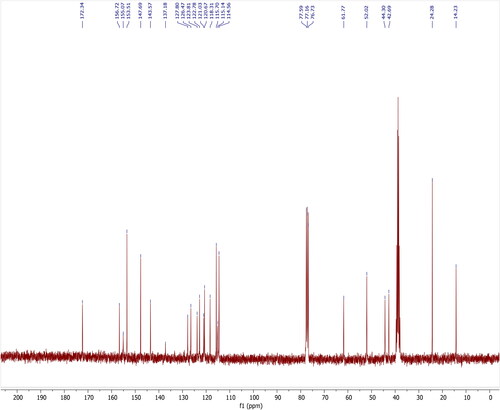
Figure 4. ORTEP representation of Olanzapinium 2,5-dihydroxybenzoate, showing the atom-numbering scheme. Displacement ellipsoids are drawn at the 30% probability level.
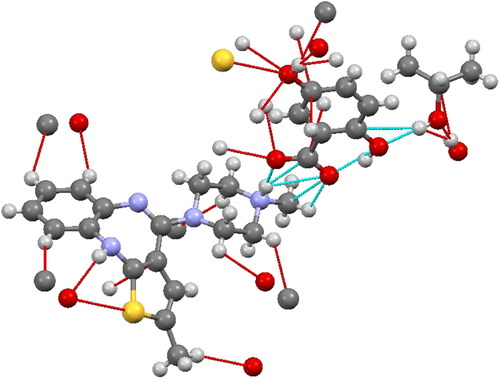
Table 1. Bond length (Å) of Olanzapinium 2,5-dihydroxybenzoate.
Table 2. Bond angles (in degree) of Olanzapinium 2,5-dihydroxybenzoate.
Figure 5. Views of the Hirshfeld surfaces of title compound mapped with dnorm in two different orientations. The HS is plotted in the range −0.1500 to 1.4938 a.u.
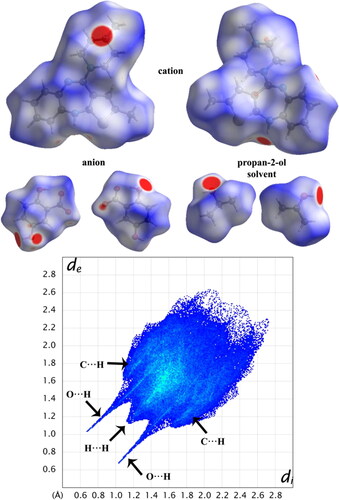
Figure 6. Views of the shape-index diagram of title compound.
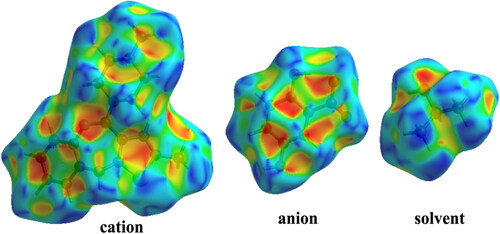
Figure 7. Protein 3 D structure of human potassium voltage-gated channel (KCNA) (PDB ID: 4BGC).
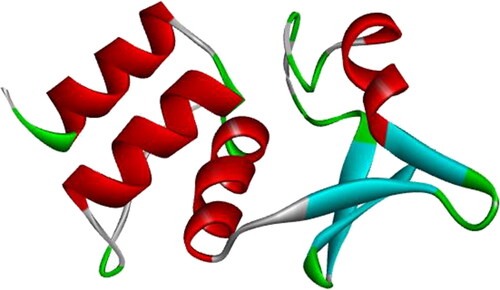
Figure 8. (A) The shape of the pore as seen at XY-axis. (B) The top view of the cavity.
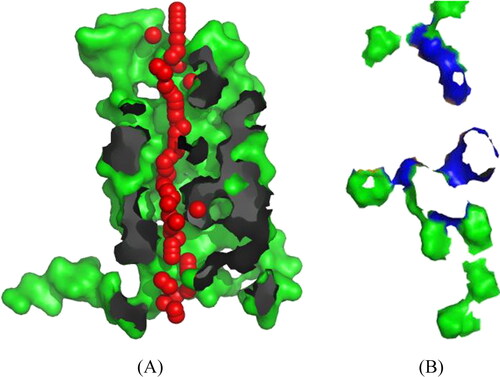
Table 3. Molecular docking results.
Figure 9. Molecular dynamics RMSD and RMSF of free human potassium voltage-gated channel (I, II); Human potassium voltage-gated channel with OLANZAPINIUM 2,5-DIHYDROXYBENZOATE.
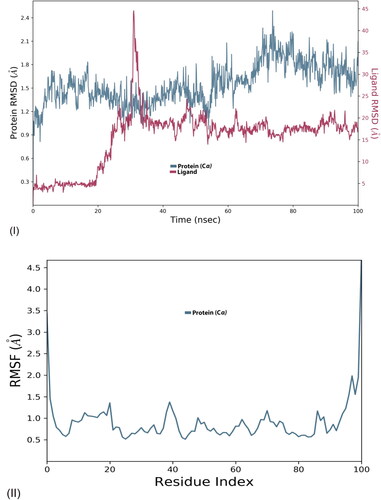
Figure 10. Interaction diagram of human potassium voltage-gated channel complex with Olanzapinium 2,5-dihydroxybenzoate observed during the molecular dynamics simulation. (A) The protein-ligand interaction diagram.
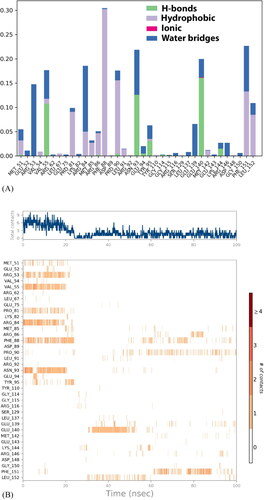
Figure 10. (B) The residues that interact with the ligand in each trajectory frame. (C) Schematic diagram of ligand interaction with the amino acid residues of protein during MD simulation.
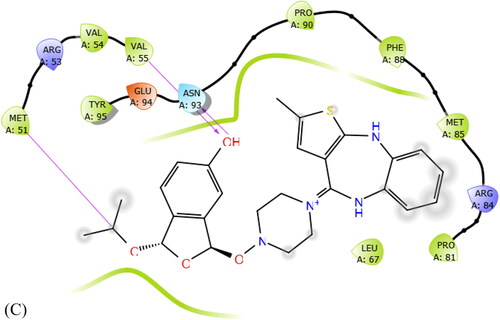
Figure 11. The ligand property trajectory of the human potassium voltage-gated channel complex with Olanzapinium 2,5-dihydroxybenzoate during the 100 ns simulation.
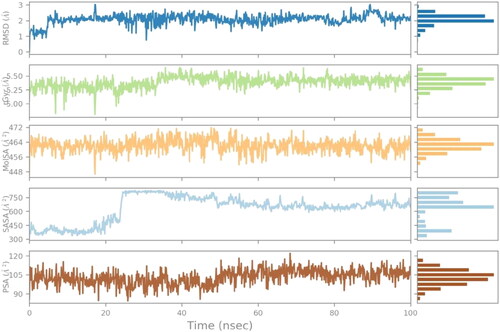
Figure 12. The most effective pose of compound Olanzapinium 2,5-dihydroxybenzoate with lowest re-rank score shows hydrogen bond interaction with a channel protein KCNA 1 (Residues in colour cyan, ligand in colour pink and hydrogen bond in black dots.)
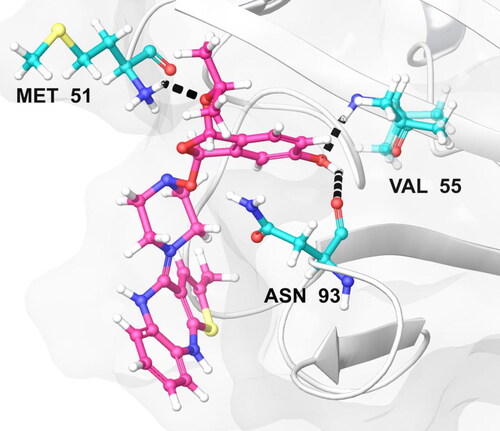
Figure 13. Electrostatic interaction of compound Olanzapinium 2,5-dihydroxybenzoate with the channel protein KVNA 1.
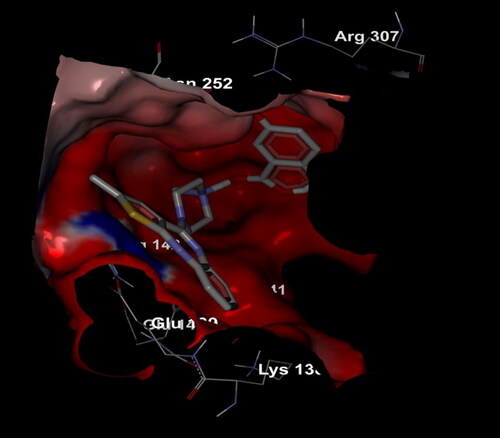
Figure 14. Van der Waals interaction of compound Olanzapinium 2,5-dihydroxybenzoate with the channel protein KVNA 1.
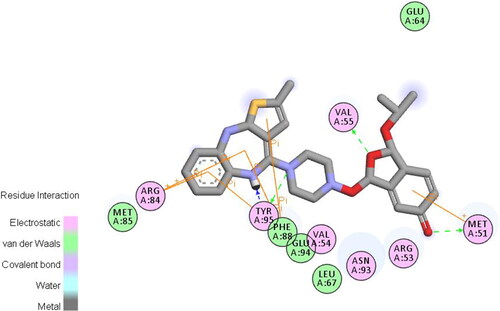
Table 4. Predicted ADMET properties of the compound by AdmetSAR program.
Table 5. ADMET predicted profile – regression.