
Figures & data
Table 1. Experimental plan for niosomal dispersion formulation: (a) Three factorial design 23, and (b) Coded level translation in actual units.
Table 2. Composition of CPM loaded niosomes displaying amount (g) of all factors used in formula to make 100 g niosomal dispersion formulation.
Figure 1a. (a) Optimised Niosomes (N3) 3D Surface plot of % Drug release response at y = pH 6. (b) Optimised Niosomes N3 interaction diagram.
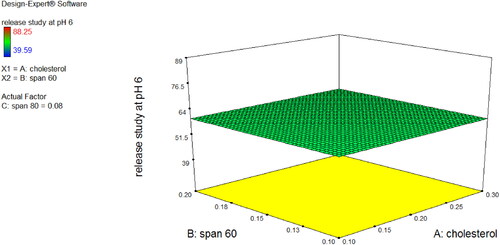
Figure 1b. (b) Optimised Niosomes N3 interaction diagram.
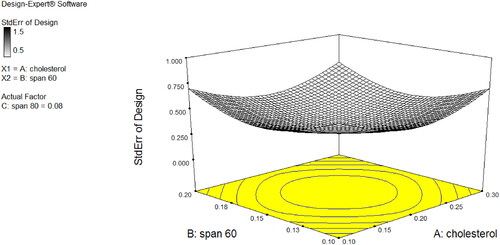
Figure 2. calibration (Linear regression) Curve at 265 nm (Phosphate buffer pH 6). In the stated equation (Y = 0.0217x + 0.0414), Y is UV absorbance at 265 λmax, m is slope (0.0217), x is concentration (µg/ml) of CPM, b is the intercept (0.0414), and R2 is correlation coefficient (0.9964).
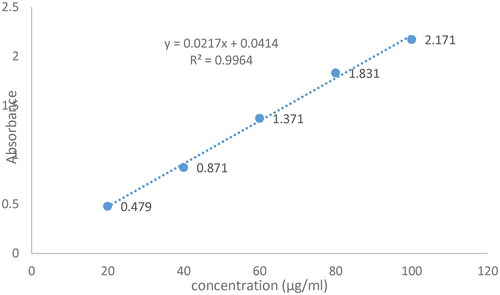
Figure 3. FTIR peaks of a = drug (CPM), b = cholesterol, c = span-60, d = span-80, e = PEG-1000, f = PG, g = carbopol-940, and h = the optimised niosomal gel of CPM (N3).
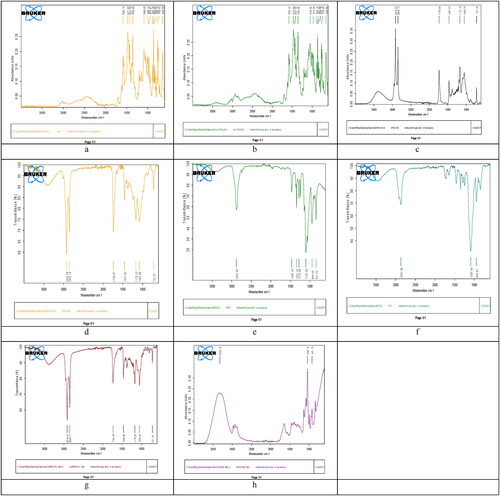
Figure 4. SEM of optimised nisomal gel of CPM (N3). Where,a = SEM of niosomal gel at 4000 magnification, b = SEM of niosomal gel at 10,000 magnification, and c&d = SEM of niosomal gel at 15,000 magnification.
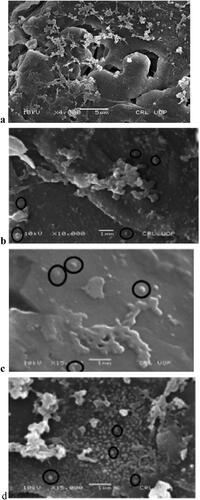
Figure 5. TG/DTA of optimised niosomal Gel of CPM (N3).
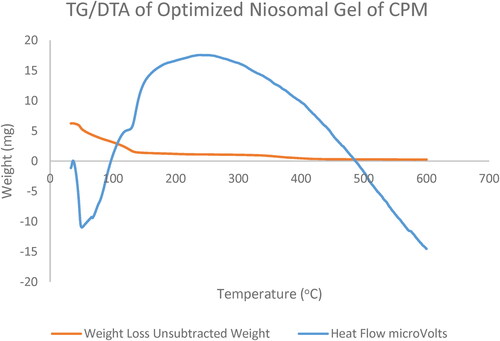
Figure 6. In vitro release (%) of CPM from Niosomal gel at pH 6.
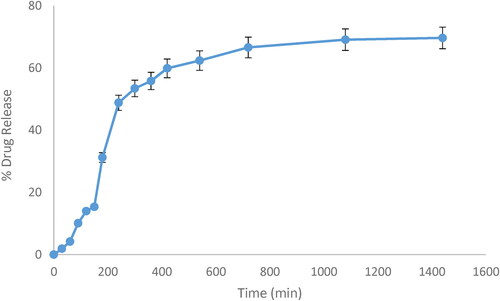
Table 3. Drug release kinetics of optimised CPM niosomal gel (N3) at pH 6.
Figure 7. a = Capsicum induced allergic skin area of Rabbit and b = CPM niosomal gel treated skin area of rabbit.
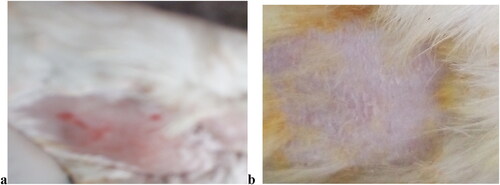
Table 4. Pharmacokinetic parameters of CPM (10.00 mg) (niosomal gel) applied topically on allergenic rabbits.
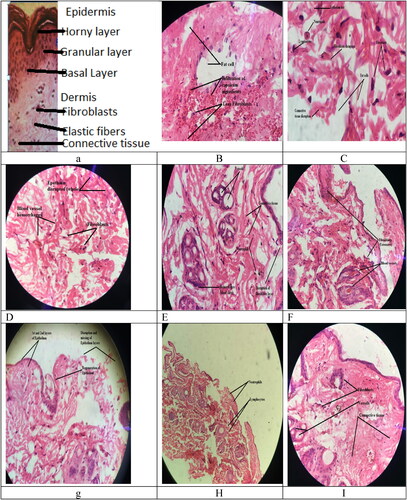
Figure 8. (a) Normal rabbit skin tissue histology; (b–e) excised capsicum treated rabbit skin tissues; (f, g) 40× power, enlarged view, (h) 10× power, (i) excised CPM niosomal gel treated rabbit skin tissues stained with haematoxylin and eosin (high magnification).
Data availability statement
All the data has been incorporated into this article.