
Figures & data
Table 1. Chemical composition of cement.
Figure 1. Glass powder for test (a) 20–100 mesh (b) 100–200 mesh (c) 200–500 mesh.
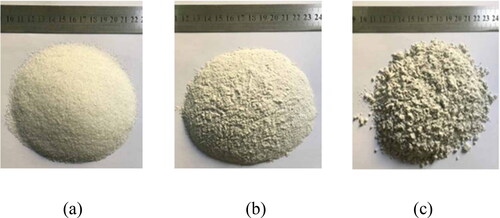
Figure 2. XRD spectrum of waste glass powder.
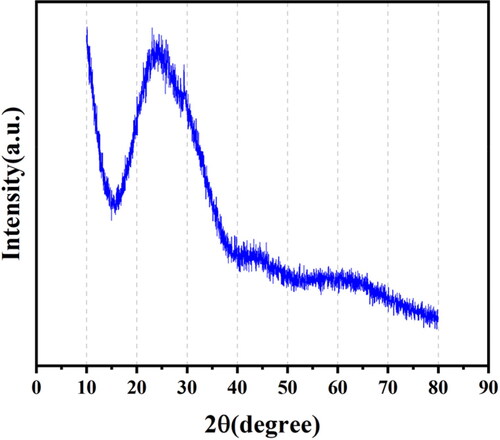
Figure 3. The flow chart of the production of waste glass powder.
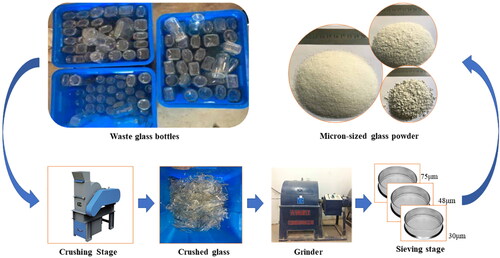
Table 2. Chemical composition of waste glass powder.
Table 3. Bulk density of glass powder and standard sand(kg/m3).
Table 4. Mix proportion of waste glass powder cement mortar.
Figure 4. Illustrative flow chart of glass cement mortar specimen preparations.
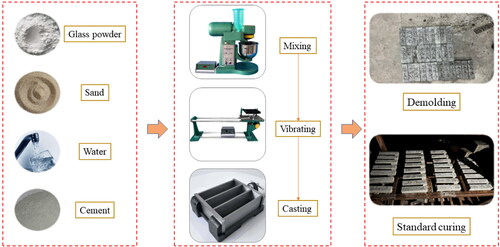
Figure 5. Effects of replacement level of 20–100 mesh glass powder used as fine aggregate on the mortar strength development.
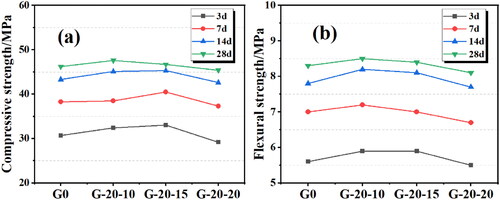
Figure 6. Effects of replacement level of 100–200 mesh glass powder used as fine aggregate on the mortar strength development.
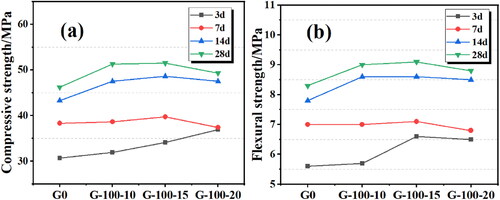
Figure 7. Effects of replacement level of 200–500 mesh glass powder used as fine aggregate on the mortar strength development.
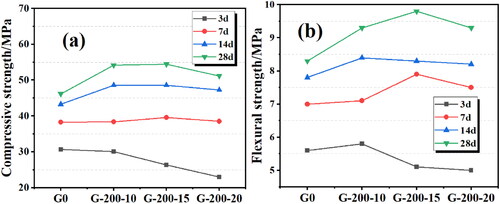
Figure 8. Strength development with age for cement mortars with different contents of 20–100 mesh glass powders used as fine aggregate.
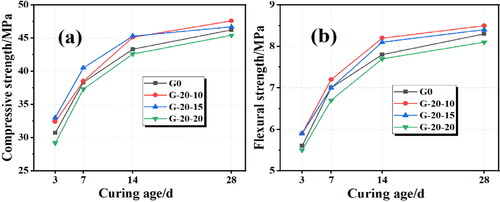
Figure 9. Strength development with age for cement mortars with different contents of 100–200 mesh glass powders used as fine aggregate.
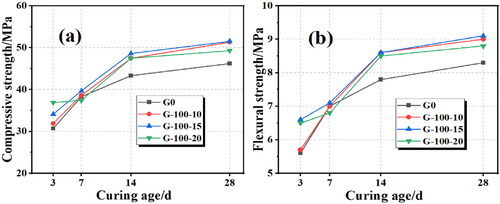
Figure 10. Strength development with age for cement mortars with different contents of 200–500 mesh glass powders used as fine aggregate.
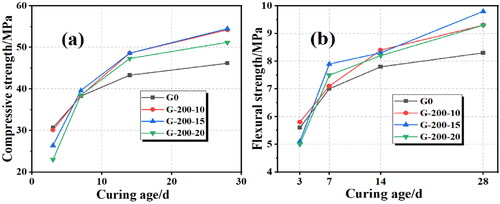
Figure 11. Effect of glass particle size on compressive strength and flexural strength of cement mortar.
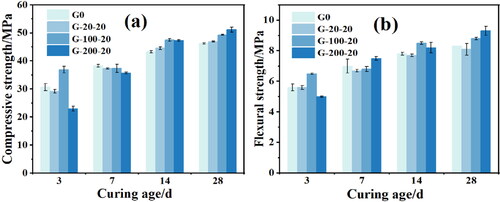
Figure 12. Relationship between compressive strength and flexural strength of cement mortar using glass aggregate.
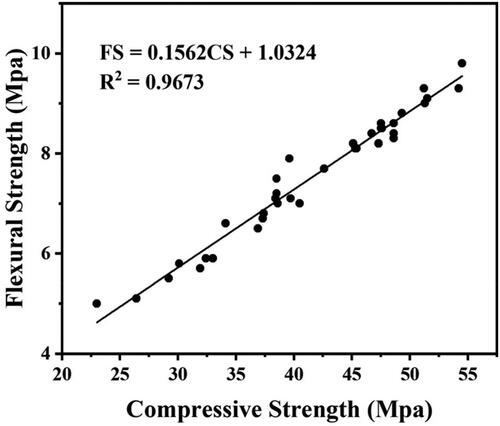
Figure 13. SEM-EDS images of ordinary cement mortar and glass mortar after 28 d hydration.
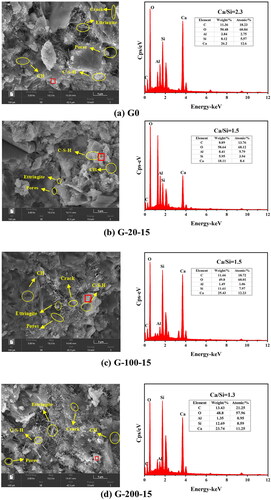
Figure 14. SEM images of interface transition zone (ITZ) in the mortar specimens G0, G-20-15 and G-200-15 after 28 d hydration.
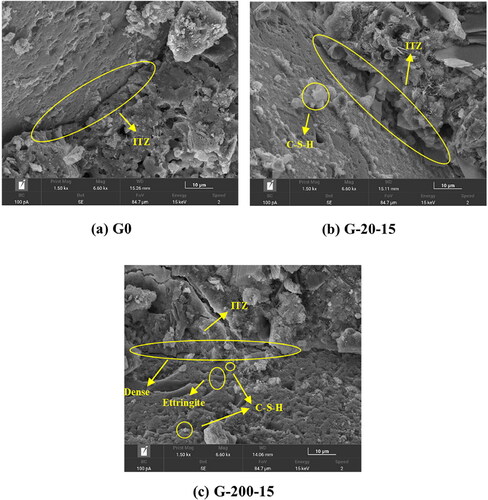
Figure 15. SEM-EDS images of 28 d cement mortar with different glass particle sizes.
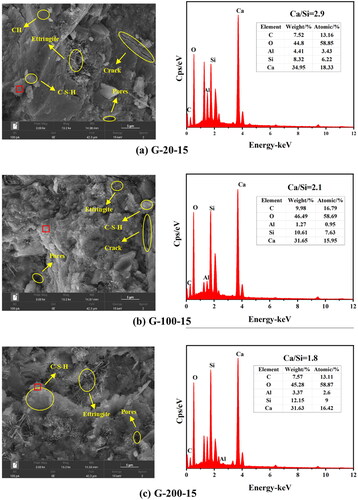
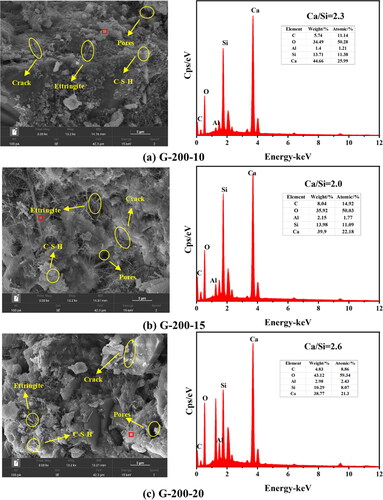
Figure 16. SEM-EDS images of 28 d cement mortar with different content of 200–500 mesh glass powder.
Data availability statement
All data generated or analysed during this study are included in this submitted article. The raw data shall be made available upon request to the corresponding author.