
Figures & data
Figure 1. Dextran conjugates and experimental workflow. (A) Chemical structures of 500 kDa molecular weight dextran (D500), NOTA-D500 conjugate, and 64Cu-NOTA-D500 probe. (B) Study design for treatment of DSS colitis animals and healthy controls.
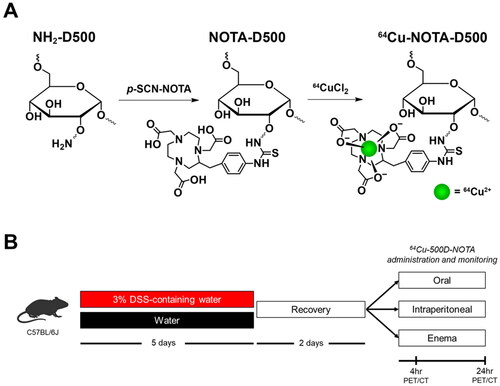
Figure 2. Histopathological micrographs of normal and inflamed colons. Control animals display an intact lining of the colon. In animals with DSS-induced colitis, erosive lesions are present with complete loss of mucosal epithelium (thick arrow), collapse of mucosa, and inflammatory cell infiltrate into the submucosa (asterisk). In both animal tissues, there is a single layer of elongated mesothelial cells closely apposed to the outer tunica muscularis (thin arrows), demonstrating an intact mesothelium.
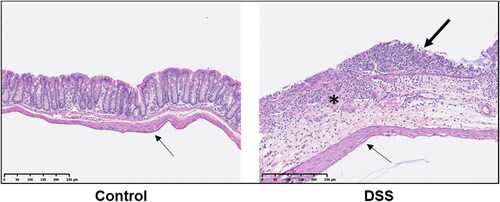
Figure 3. Biodistribution of 64Cu-NOTA-D500 differs by mode of administration in control (Con) and animals with colitis (DSS). Quantitative gamma well counting results 24 hr following (A) oral; (B) enema; or (C) intraperitoneal (IP) administration of 64Cu-NOTA-D500. Data are shown as mean ± SEM of the % injected dose per gram of tissue (I.D./g), n = 3/group. *Indicates significantly different from Con (p < 0.05 by Wilcoxon Rank Sum). Abbreviations: subcutaneous (SubQ), left/right gonadal (L/R Gon), left/right perirenal (L/R PR), and mesenteric (Mes) adipose depots; stomach (Stom); duodenum (Duod); jejunum (Jeju); proximal colon (ProxCol); mid colon (MidCol); distal colon (DistCol).
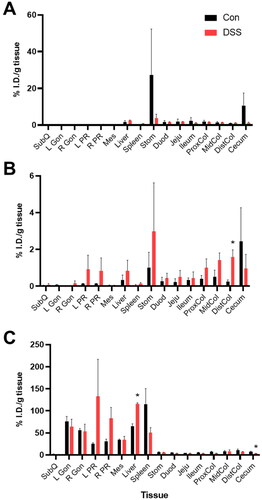
Table 1. Tissue biodistribution of radiolabeled dextran conjugate by mode of administration.a
Table 2. Tissue biodistribution by mode of administration relative to liver and total intestinal uptake of radiolabeled dextran conjugate.a
Figure 4. Improvement in inter-subject variability of probe retention in intestinal tissues by normalization. Data points represent the percent relative standard deviation (RSD) with and without normalization to liver or total intestines for 7 intestinal tissues after administration by oral (black circles), enema (blue squares), and IP (red triangles) routes in both healthy (Con) and colitis-affected animals (DSS). Data points below the diagonal line show a reduction in variability due to normalization; those above the vertical line show an increase in variability. (A) Normalization by liver uptake led to improved or worse intestinal tissue RSD for oral and enema administration routes but smaller changes in the RSD for IP administration. (B) Normalization by total intestinal tissue led to reductions in the RSD for oral and enema administration routes, with smaller changes observed for IP administration.
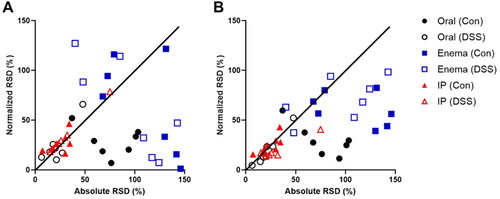
Figure 5. PET quantification of 64Cu-NOTA-D500 differs by mode of administration in control (Con) animals and animals with colitis (DSS). (A) Reconstructed PET/CT images 4 and 24 hr following probe administration (oral gavage, enema, or intraperitoneal [IP] injection) with enema-delivered iodine-based contrast to visualize intestines. (B) Total injected dose (I.D.) measured by CT-segmented PET images 4 and 24 hr post-administration (oral, enema, IP) in both Con and DSS animals. (C) Comparison of PET results with gamma well counting (GWC) results 24 hr post-administration. Data are shown as the % injected dose per gram of tissue (I.D./g) for single animal PET/CT imaging and comparative ex vivo GWC radioisotopic measurements. Abbreviations: stomach (Stom); duodenum (Duod); jejunum (Jeju); proximal colon (ProxCol); mid colon (MidCol); distal colon (DistCol).
![Figure 5. PET quantification of 64Cu-NOTA-D500 differs by mode of administration in control (Con) animals and animals with colitis (DSS). (A) Reconstructed PET/CT images 4 and 24 hr following probe administration (oral gavage, enema, or intraperitoneal [IP] injection) with enema-delivered iodine-based contrast to visualize intestines. (B) Total injected dose (I.D.) measured by CT-segmented PET images 4 and 24 hr post-administration (oral, enema, IP) in both Con and DSS animals. (C) Comparison of PET results with gamma well counting (GWC) results 24 hr post-administration. Data are shown as the % injected dose per gram of tissue (I.D./g) for single animal PET/CT imaging and comparative ex vivo GWC radioisotopic measurements. Abbreviations: stomach (Stom); duodenum (Duod); jejunum (Jeju); proximal colon (ProxCol); mid colon (MidCol); distal colon (DistCol).](/cms/asset/5644ac27-48d0-4fea-9825-9b47dd2cdad6/tjen_a_2134563_f0005_c.jpg)
Supplemental Material
Download MS Word (3.2 MB)Data availability statement
The data that support the findings of this study are available from the corresponding author, KSS and AMS, upon reasonable request.