
Figures & data
Figure 1. Schematic representation of the system setup.
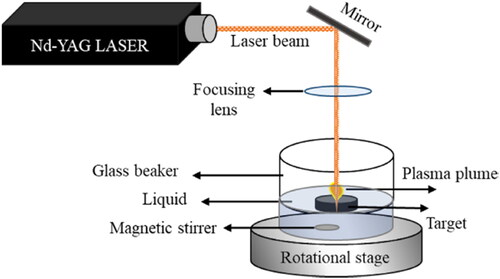
Figure 2. HR-TEM images of the ZnO NPs produced at (a, d) 70 mJ, (b, e) 90 mJ, and (c, f) 130 mJ. Size distribution of the ZnO NPs obtained using the computer software ‘Image J’, based on several high magnification TEM images at (g) 70 mJ, (h) 90 mJ, and (i) 130 mJ.
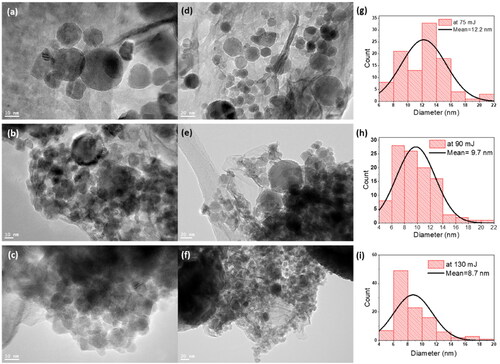
Figure 3. SEM-EDX data of ZnO NPs at (a) 70 mJ, (b) 90 mJ, and (c) 130 mJ.
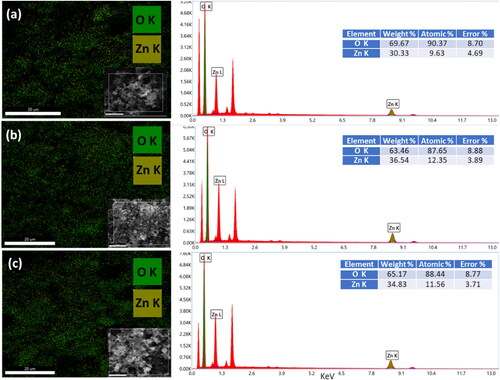
Figure 4. HR-TEM images of ZnO NPs (a) at 70 mJ, (b)(c) FFT images of the red square after selecting diffraction spots, (d)(e) the IFFT for selected diffraction spots in b, c, (f) at 90 mJ, (g)(h) FFT images of the blue square after selecting diffraction spots, (i)(j) the IFFT for selected diffraction spots in g, h, (k) at 130 mJ, (l)(m) FFT images of the white square after selecting diffraction spots, (n)(o) the IFFT for selected diffraction spots in (l), (m).
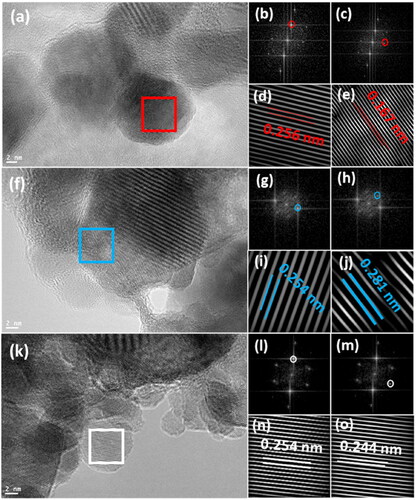
Figure 5. Zeta-size and zeta-potentials figures of ZnO NPs at different pulsed laser energy.
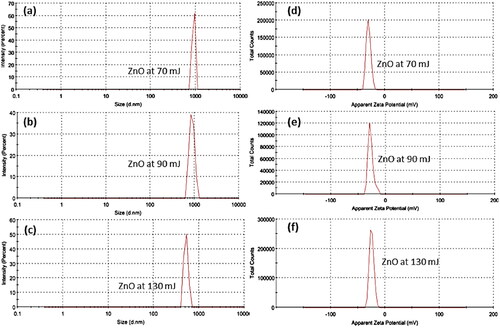
Figure 6. UV-Visible absorption spectra of the ZnO NPs produced at various laser ablation energies.
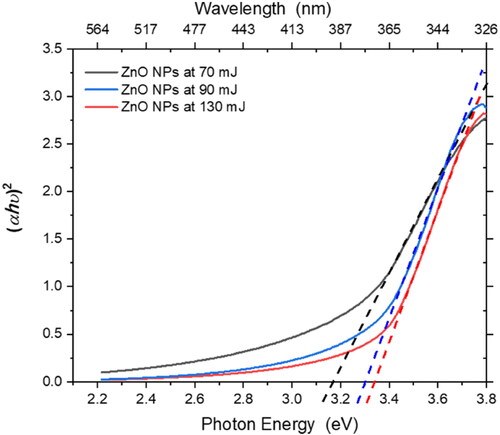
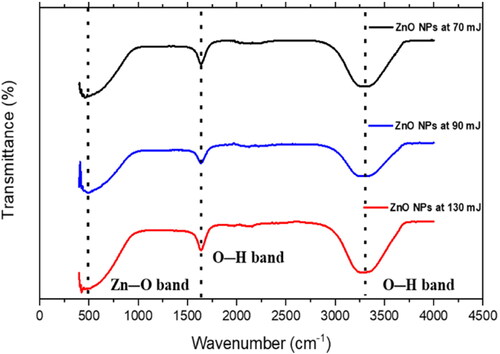
Figure 7. FTIR spectra of the ZnO NPs at various laser ablation energies.
Availability of data and materials
All materials are owned by the author and/or no permissions are required.