Figures & data
Figure 1. The two-dimensional Chemical structure of Infigratinib.
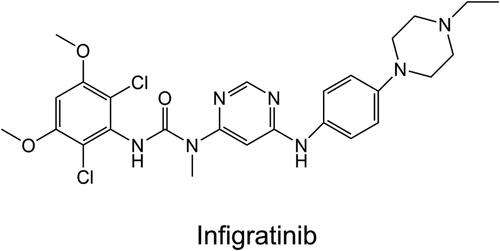
Figure 2. Overview of the crystal structure of FGFR2 kinase domain (PDB ID: 3RI1).
The α-helices, β-strands, and loops are colored red, yellow, and gray, respectively. The hinge domain is colored green spheres. The P-loop, helix αC, and A-loop are colored blue, purple, and orange, respectively.
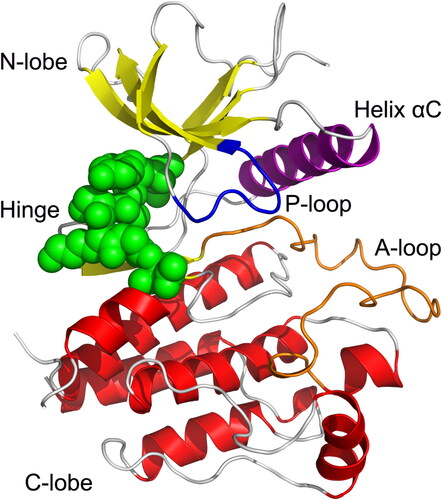
Figure 3. The docked conformation of the FGFR2 kinase domain with Infigratinib. The hinge residues Glu565 and Ala567 are Depicted by sticks. Hydrogen bonds are shown by yellow dotted lines.
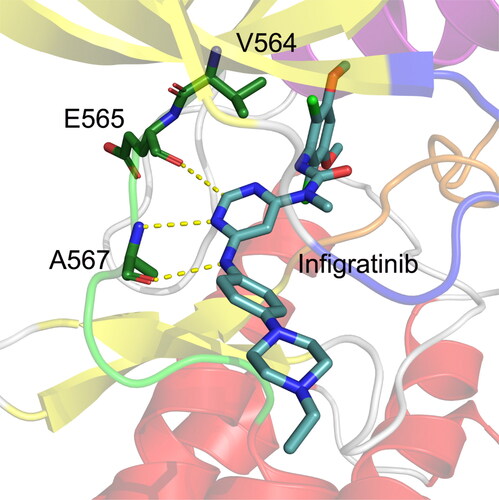
Figure 4. RMSD values of the Cα atoms of the FGFR2 kinase domain (a) and the heavy atoms of Infigratinib (b) for the FGFR2-WT (a) and FGFR2-V564F (b) in the process of MD simulations.
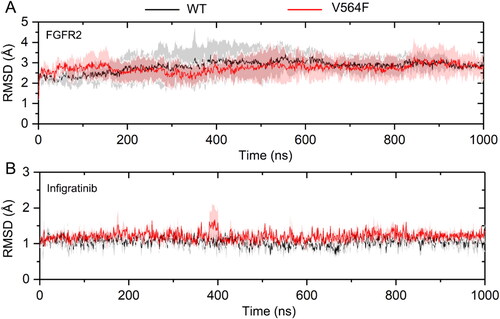
Figure 5. The Cα RMSF of the FGFR2-WT and FGFR2-V564F mutant.
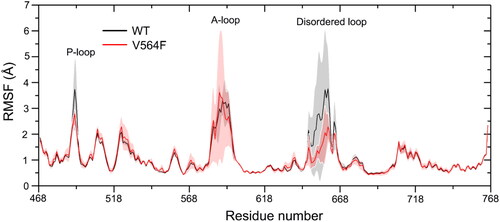
Figure 6. Correlations between the Cα atoms of the FGFR2-WT (a) and the FGFR2-V564F (b) mutant. Correlation values are represented by a color gradient of blue to red.
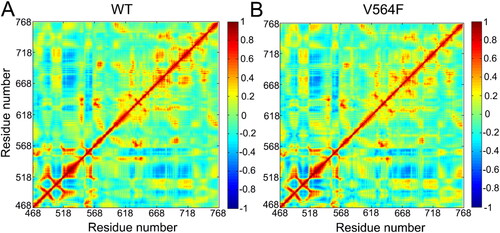
Table 1. Binding free energies of Infigratinib in FGFR2-WT and FGFR2-V564F (kcal/mol).
Figure 7. The energetic differences of the residue contributions to the binding free energies between the FGFR2-WT and FGFR2-V564F mutant systems (ΔΔG=ΔGWT − ΔGV564F).
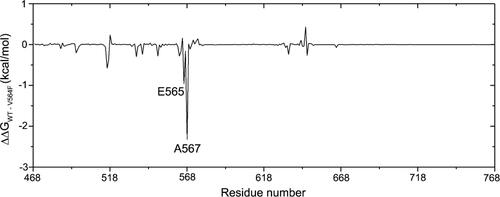
Table 2. Percent of occurrence data (%) for hydrogen bonds between Ala567 and Infigratinib.
Figure 8. The distance (Å) between the pyrimidine C(2)-H of Infigratinib and the backbone carbonyl oxygen of Glu565 for the FGFR2-WT (a) and FGFR2-V564F (b) in the process of MD simulations.
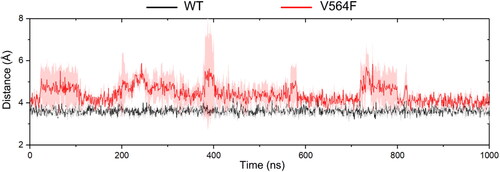
Figure 9. Free energy landscape for the FGFR2-WT (a) and FGFR2-V564F (b). the unit of the free energy landscape is kcal/mol.
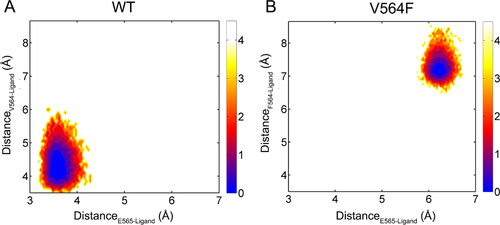
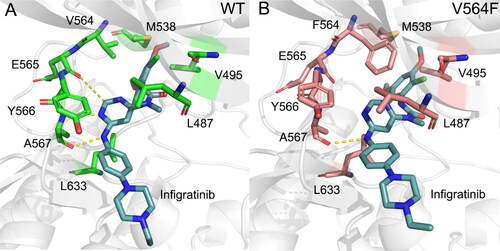
Figure 10. The Representative structures of FGFR2-WT (a) and FGFR2-V564F (b). hydrogen bonds are colored by yellow dotted lines and the key residues are shown by sticks.