Figures & data
Figure 1. Green synthesis of FeO/FeO2 NPs using aerial part of E. tirucalli.
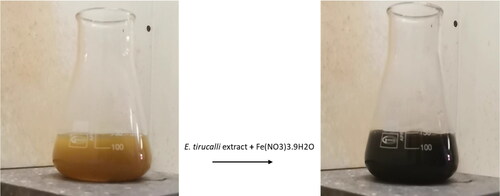
Figure 2. Ultraviolet visible spectroscopy of FeO (a) and FeO2 (b) from E. tirucalli.
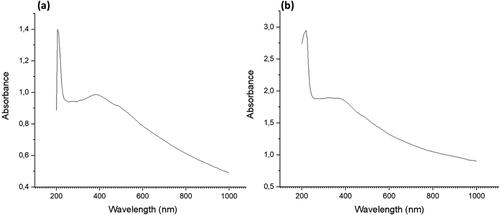
Figure 3. FTIR spectrum analysis of (a) iron oxide (FeO) and (b) iron dioxide (FeO2) NPs reduced using E. tirucalli. Black line (B:FeO-RT) represents NPs at room temperature and red (D:FeO2-500 °C)represent the annealed NPs at 500 °C.
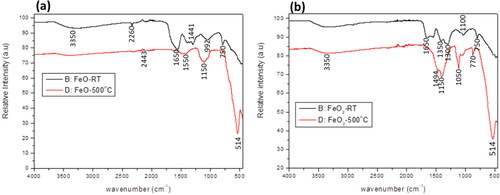
Figure 4. X-ray diffraction analysis of reduced FeO (a) and FeO2 (b) NPs from E. tirucalli aerial parts after annealing.
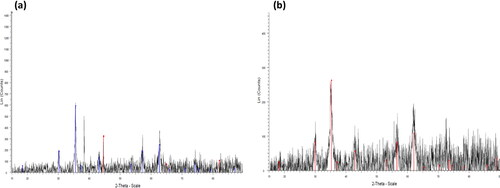
Figure 5. XPS analysis of FeO2 NPs: high resolution FeO2 scan (a); FeO2-2p1 scan (b), FeO2-O1s scan (c).
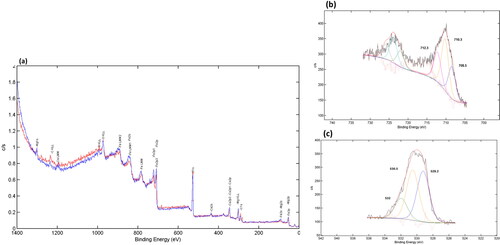
Figure 6. SEM imaging of (a) FeO and (b) FeO2 observed at 100 nm.
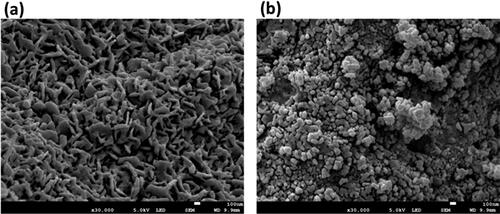
Figure 7. TEM imaging (a) and EDS analysis of FeO NPs synthesized using aerial parts of E. tirucalli (b).
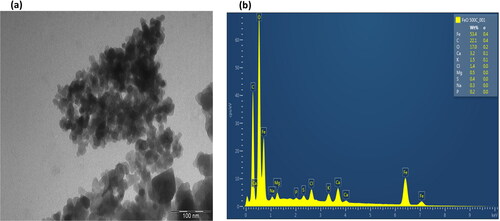
Figure 8. TEM imaging (a) and EDS analysis of FeO2 NPs synthesized using aerial parts of E. tirucalli (b).
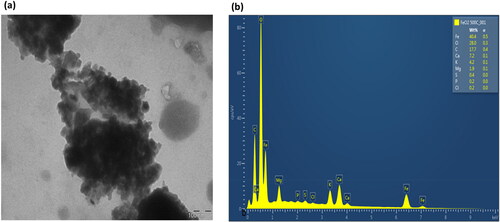
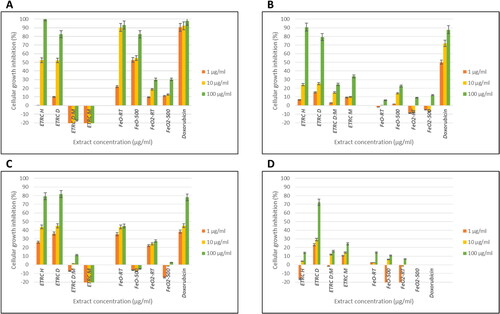
Figure 9. Cell growth inhibition % of four Euphorbia crude extracts, FeO-RT, FeO-500, FeO2-RT and FeO2-500 NPs against MCF-7 (a), SK-BR-3 (B), MDA-MB231 (C) and Vero (D). E. tirucalli hexane (ETRC Hex) extract, E. tirucalli Dichloromethane (ETRC DCM), E. tirucalli Dichloromethane: Methanol (ETRC DCM: MeOH), E. tirucalli methanol (ETRC MeOH), iron oxide unannealed NPs (FeO-RT), iron oxide annealed NPs (FeO-500), iron dioxide unannealed NPs (FeO2-RT) and iron dioxide annealed NPs (FeO2-500). Doxorubicin (standard drug).
*FeO2-500 NPs was not tested on Vero cell line.