
Figures & data
Figure 1. Flowchart for hydrothermal synthesis of MgO nanocrystalline powders.
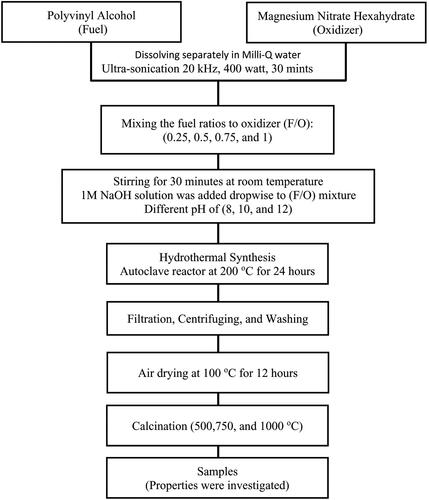
Table 1. Experimental conditions for synthesizing MgO nanoparticles.
Figure 2. X-ray diffraction patterns of nanocrystalline MgO powders synthesized at (a) different F/O ratios (b) different pH and (c) different annealing temperatures.
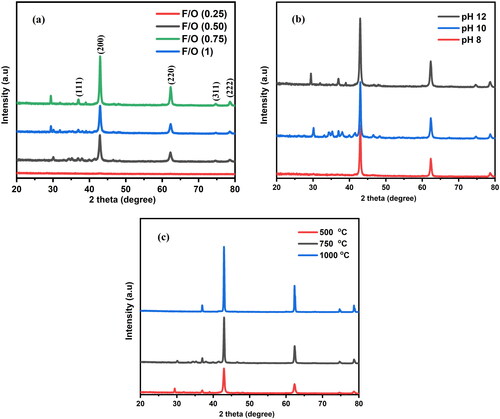
Table 2. Lattice parameter (a), crystalline size, X-ray density (), percentage of porosity, dislocation density (δ) and lattice strain (ε) of MgO nanocrystal for different ratio of fuel-to-oxidizer, deferent pH and different annealing temperature.
Figure 3. Crystallite size and dislocation density values of the nanocrystalline MgO powders at (a) different F/O (b) different pH and (c) different annealing temperatures.
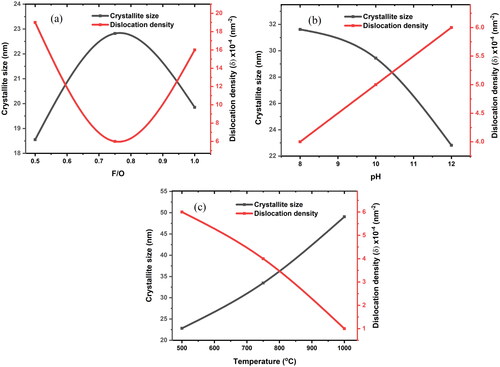
Figure 4. The Rietveld refinements of nanocrystalline MgO powders synthesized at F/O (0.75): (a–c) pH 12, annealed at 500 °C, 750 and 1000, respectively (d) pH 10, annealed at 500 °C (e) pH 8, annealed at 500 °C.
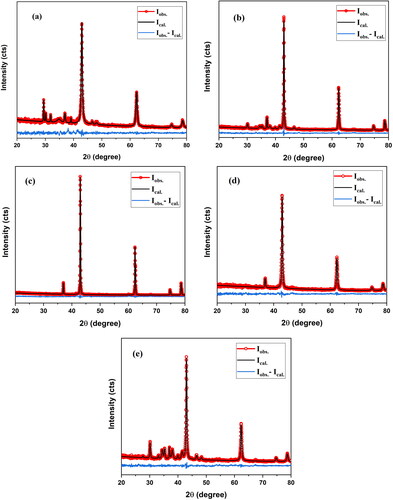
Table 3. Profile factor (Rp), weighted residual factor (Rwp), expected residual factor (Rexp) and goodness of fit (χ2) of MgO samples from Rietveld refinement.
Table 4. EDS data for MgO at various synthesis conditions.
Figure 5. FESEM images and EDS spectra of the MgO samples annealed at temperatures of (a) 500 °C, (b) 750 °C and (d) 1000 °C.
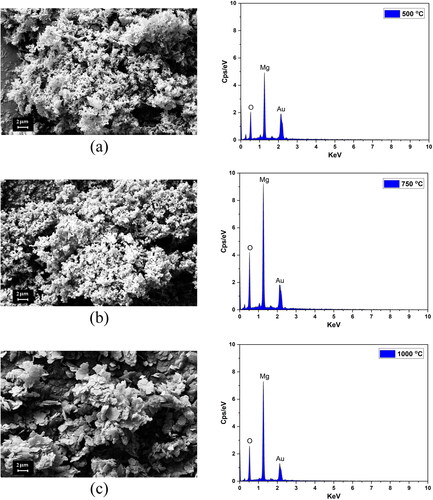
Figure 6. FTIR spectrum of nanocrystalline MgO powders synthesized att (a) different F/O (b) different pH and (c) different annealing temperatures.
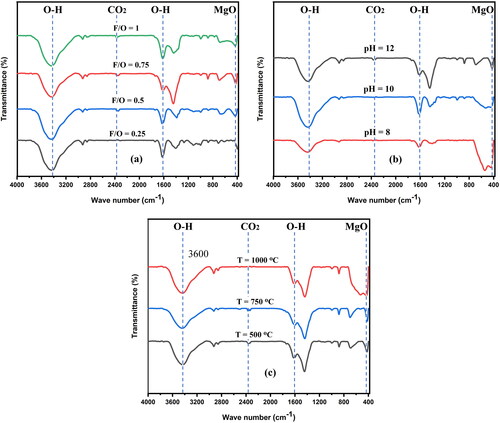
Figure 7. Diffuse reflectance spectra of the nanocrystalline MgO powders synthesized at (a) different F/O ratios (b) different pH and (c) different annealing temperatures.
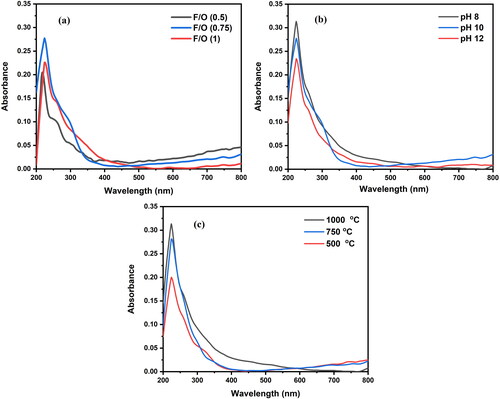
Figure 8. The Kubelka–Munk elaboration of the nanocrystalline MgO powders synthesized at (a) different F/O ratios (b) different pH and (c) different annealing temperatures.
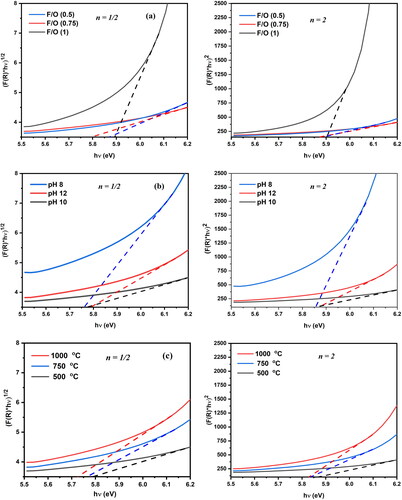
Table 5. Direct and indirect band gap of nanocrystalline MgO powders at various synthesis conditions.
Table 6. Comparison of bandgap widths and average particle size of MgO nanoparticles.
Data availability
All data that support the findings of this study have been included in the article.