
Figures & data
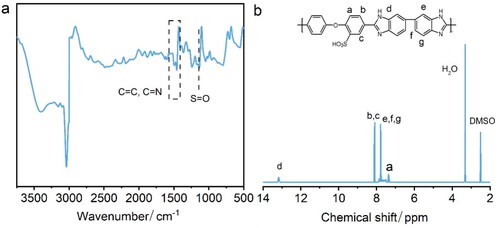
Figure 1. FT-IR spectra (a) and 1H NMR spectra(b) of SOPBI membranes.
Scheme 1. Synthesis procedures of OPBI and SOPBI.
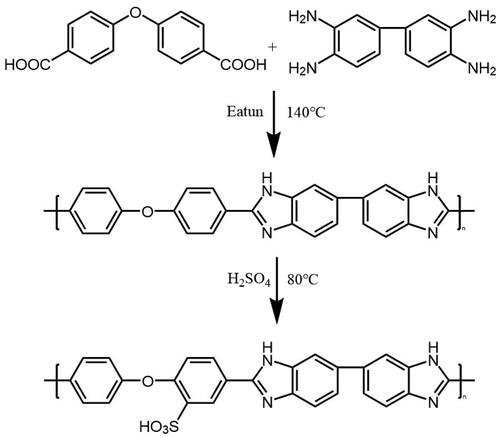
Figure 2. Surface (a) and cross-section (b) morphology SOPBI membranes.
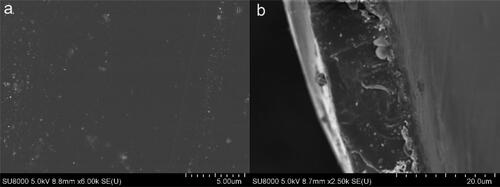
Figure 3. TEM images of SOPBI membranes.
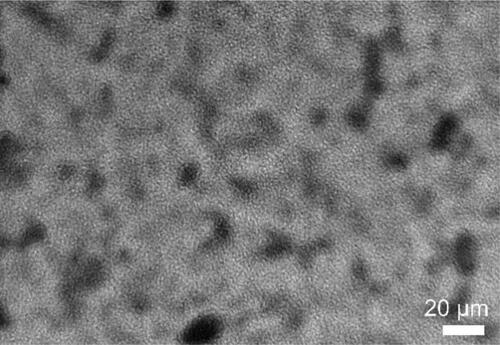
Figure 4. Thickness, H2SO4 doping level, SR, IEC and area resistance of the SOPBI membranes.
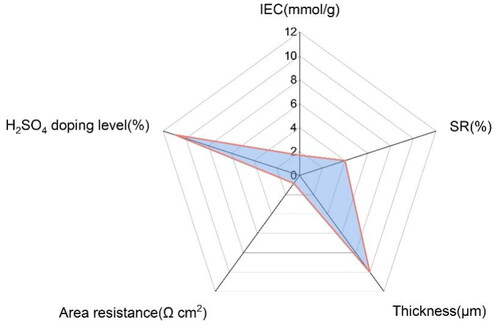
Figure 5. Tensile stress versus elongation of 3 M H2SO4 doped SOPBI membranes.
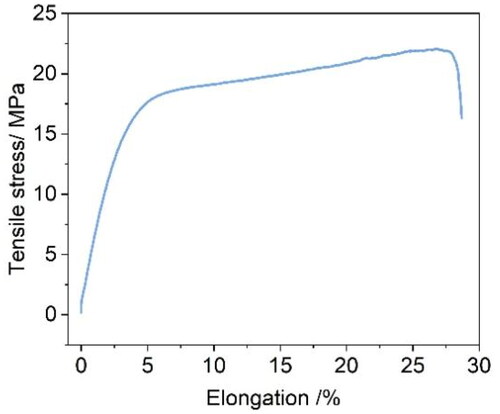
Figure 6. (a–d) Photos of diffusion cell at RT for 168h; (e)The concentration of the VO2+ ions in the receiving reservoir of the diffusion cell with membranes as a function of time.
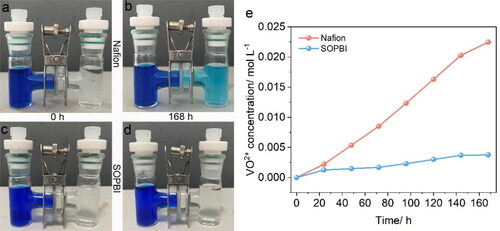
Figure 7. (a) The molecular structure and (b) the electrostatic potential of SOPBI, (c) The molecular structures and (d) the binding energy of SOPBI-H1 and SOPBI-H2.
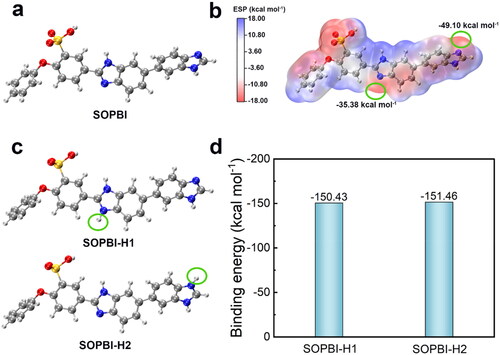
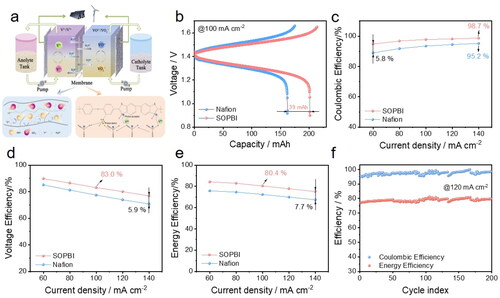
Figure 8. (a) Schematic illustration of an all-vanadium redox flow batteries; (b) Charge-discharge curves of various membranes at a current density of 100 mA cm−2; CE (c), VE (d) and EE (e) of VRFB single cells assembled with: Nafion212 and SOPBI membranes at various current densities; (f) Cycling performance of the VRFB single cell with SOPBI at 120 mA cm−2.
Data availability statement (DAS)
The authors confirm that the data supporting the findings of this study are available within the article.