
Figures & data
Figure 1. The DTG, TG, and DTA curves of the synthesized precursor powder.
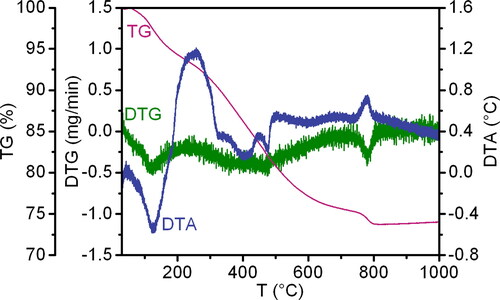
Figure 2. The IR spectra of the precursor samples obtained following thermal decomposition at temperatures ranging from 120 to 1000 °C.
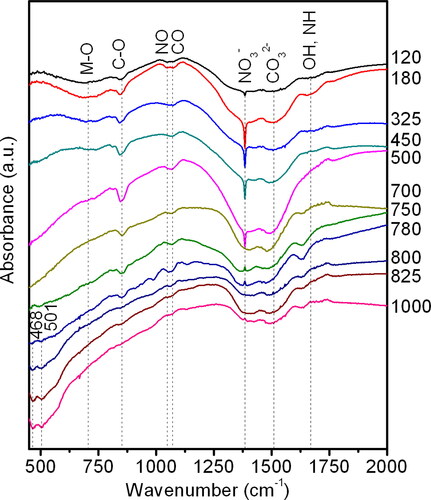
Figure 3. The nitrogen sorption isotherms (a) and differential size distribution of mesopore volumes and surfaces (b, c) on the intermediate samples after precursor thermal decomposition at temperatures up to 750 °C.
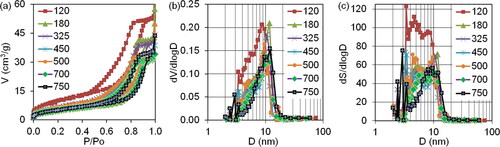
Figure 4. The temperature dependence of the general characteristics of the samples porosity during the thermal decomposition of the precursor is investigated. Where: Vsum (cm3/g) – the total pore volume within the measurement range of the adsorption-structure method (0.3-300 nm); SBET (m2/g) – the specific surface area, calculated by the BET method; vme (cm3/g), sme (m2/g) – the total volume and specific surface area of the mesopores, calculated by the BJH method; DavgBET, DavgBJH (nm) – the average equivalent pore diameter, calculated using the BET and BJH methods.
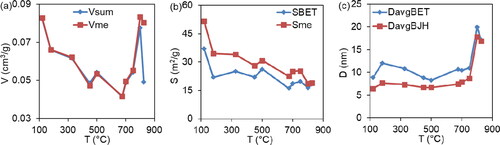
Figure 5. The nitrogen sorption isotherms (a) and differential size distribution of mesopore volumes and surface areas (b, c) on intermediate samples after precursor thermal decomposition at a temperature range of 750-825 °C.
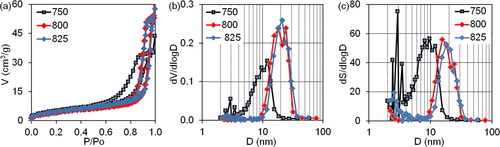
Figure 6. The diffraction patterns of the synthesised precursor samples during the first stage of thermal decomposition at temperatures ranging from 120 to 700 °C.
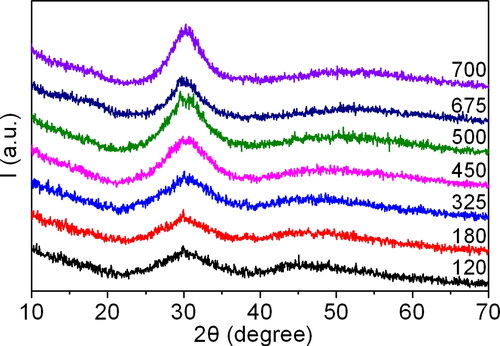
Figure 7. The diffraction patterns of the synthesised precursor samples during the second stage of thermal decomposition at temperatures ranging from 750 to 825 °C.
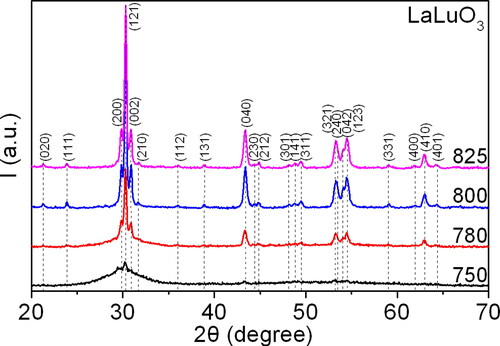
Figure 8. The dependence of the sample crystallite size on temperature.
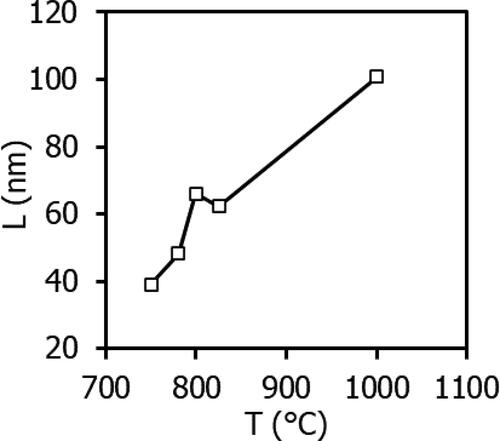
Table 1. Unit cell periods (a, b, c), theoretical density ρXRD and equivalent diameter dBET of precursor samples after thermal decomposition at temperatures from 750 to 1000 °C.
Figure 9. Typical SEM micrographs (a, b), particle size distribution (c) and EDS spectrum (d) of the final product particles resulting from the thermal decomposition of the synthesized precursor.
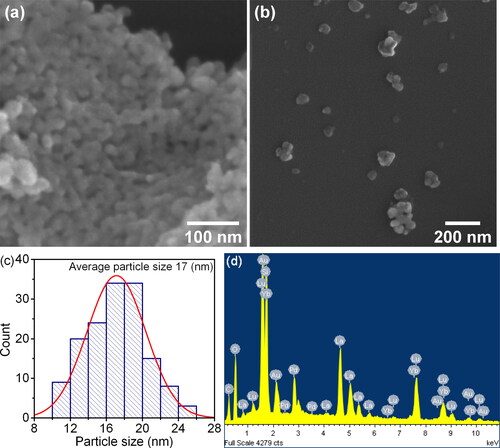
Figure 10. (a) TEM image of a perovskite particle with corresponding (b) SAED pattern along [723] zone axis, and polycrystalline agglomerate of perovskite particles with corresponding SAED pattern (c, d) along zone axis.
![Figure 10. (a) TEM image of a perovskite particle with corresponding (b) SAED pattern along [723] zone axis, and polycrystalline agglomerate of perovskite particles with corresponding SAED pattern (c, d) along [7¯45] zone axis.](/cms/asset/96ff2da5-a10c-43a0-9fe0-63308afdf474/tjen_a_2366269_f0010_b.jpg)
Data availability statement
Research data are not shared.