374
Views
9
CrossRef citations to date
0
Altmetric
Original Articles

Arrays of Cu2+-complexed organic clusters grown on gold nano dots

, , &
Pages 3-11 | Received 01 Jun 2006, Accepted 01 Jul 2006, Published online: 02 Dec 2010

Figures & data

Figure 1. Fabrication scheme: (a) Nanospheres deposited on SiO2 surface, (b) metal evaporation onto the spheres and into the layer gaps, (c) dichloromethane dissolution of the nanospheres, (d) adsorption of SH(CH2)15COOH (arrows) monolayers, (e) Cu2+ ion (small dots) complexation to SH(CH2)15COOH monolayers, (f) adsorption of a second SH(CH2)15COOH layer on top of a Cu2+ layer.
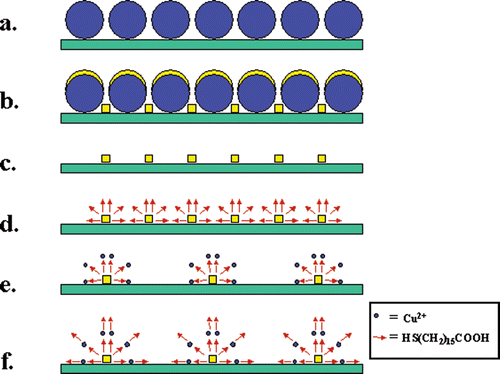
Figure 1. Fabrication scheme: (a) Nanospheres deposited on SiO2 surface, (b) metal evaporation onto the spheres and into the layer gaps, (c) dichloromethane dissolution of the nanospheres, (d) adsorption of SH(CH2)15COOH (arrows) monolayers, (e) Cu2+ ion (small dots) complexation to SH(CH2)15COOH monolayers, (f) adsorption of a second SH(CH2)15COOH layer on top of a Cu2+ layer.

Figure 2. FESEM image of an array of close-packed one-micron polystyrene nanospheres formed by spin-coating the nanosphere solution onto a SiO2 substrate. Scale bar = 10 µm.
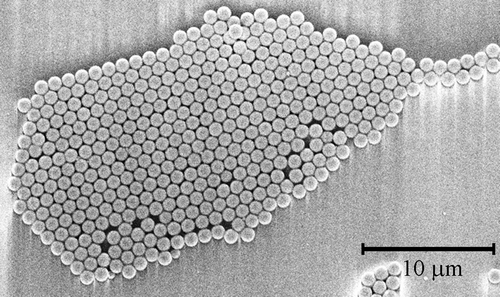
Figure 2. FESEM image of an array of close-packed one-micron polystyrene nanospheres formed by spin-coating the nanosphere solution onto a SiO2 substrate. Scale bar = 10 µm.

Figure 3. FESEM image of an array of Au/Ti particles formed by evaporating the metals through holes in a hexagonally packed 240 nm nanosphere mask. Particle shadow is formed by the FESEM detector position and is not inherent to the sample. Scale bar = 250 nm.
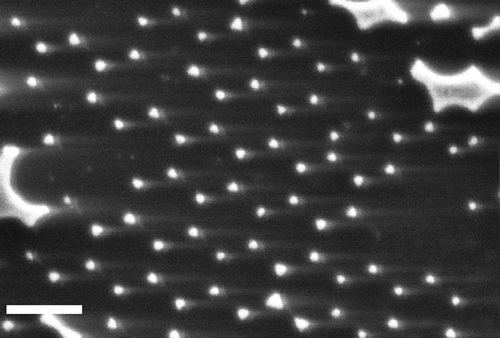
Figure 3. FESEM image of an array of Au/Ti particles formed by evaporating the metals through holes in a hexagonally packed 240 nm nanosphere mask. Particle shadow is formed by the FESEM detector position and is not inherent to the sample. Scale bar = 250 nm.

Figure 4. FESEM image of 10 layers of Cu2+ complexed 16-mercaptohexadecanoic molecular layers grown on a gold dot array. The sample was coated with 2 nm evaporated gold to enhance SEM contrast and to stabilize the organic structures that are otherwise sensitive to the electron beam. Nanospheres with diameters of 240 nm were used as a mask for this gold dot arrays. The scale bar indicates 100 nm.
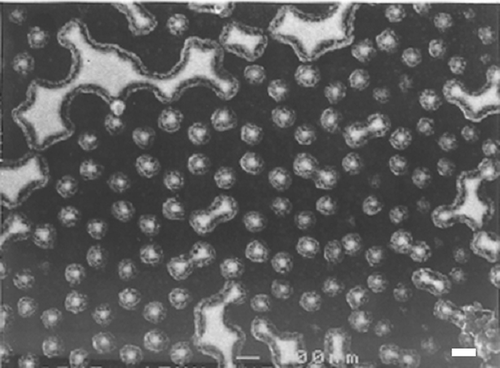
Figure 4. FESEM image of 10 layers of Cu2+ complexed 16-mercaptohexadecanoic molecular layers grown on a gold dot array. The sample was coated with 2 nm evaporated gold to enhance SEM contrast and to stabilize the organic structures that are otherwise sensitive to the electron beam. Nanospheres with diameters of 240 nm were used as a mask for this gold dot arrays. The scale bar indicates 100 nm.
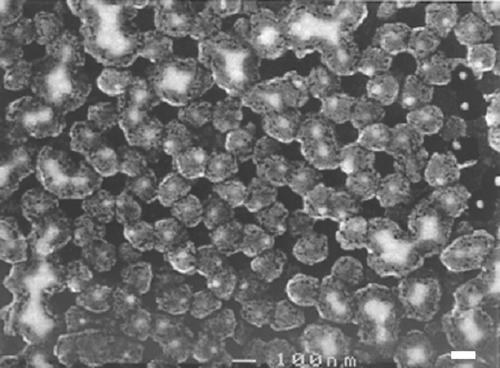
Figure 5. FESEM image of 20 layers of Cu2+ complexed mercapto-alkanoic molecular layers grown on a gold dot array: The sample was coated with 2 nm evaporated gold to enhance SEM contrast and to stabilize the organic structures that are otherwise sensitive to the electron beam. Nanospheres with diameters of 240 nm were used as a mask for this gold dot arrays. The scale bar indicates 100 nm.

Figure 5. FESEM image of 20 layers of Cu2+ complexed mercapto-alkanoic molecular layers grown on a gold dot array: The sample was coated with 2 nm evaporated gold to enhance SEM contrast and to stabilize the organic structures that are otherwise sensitive to the electron beam. Nanospheres with diameters of 240 nm were used as a mask for this gold dot arrays. The scale bar indicates 100 nm.

Figure 6. Illustration of the second metal-deposition step and removal of the organic structures: (a) The organic multilayer structure on the original gold-dot array as shown in , (b) gold (with a 2 nm Ti precursor layer) is evaporated on top of the organic layers, and into the gaps between them. In these gaps the gold is deposited directly onto the SiO2/Si surface, (c) the organic layers and the gold on top of it are removed in an organic solvent Citation14, to leave only the original gold structures and the new ‘daughter’ gold structures on the surface. The squares represent the original gold dot structures and the rectangles represent the star-shaped new gold structures as shown in .
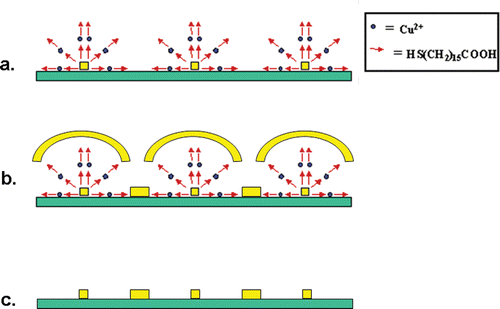
Figure 6. Illustration of the second metal-deposition step and removal of the organic structures: (a) The organic multilayer structure on the original gold-dot array as shown in figure 5, (b) gold (with a 2 nm Ti precursor layer) is evaporated on top of the organic layers, and into the gaps between them. In these gaps the gold is deposited directly onto the SiO2/Si surface, (c) the organic layers and the gold on top of it are removed in an organic solvent Citation14, to leave only the original gold structures and the new ‘daughter’ gold structures on the surface. The squares represent the original gold dot structures and the rectangles represent the star-shaped new gold structures as shown in figure 7.

Figure 7. Subsequent gold deposition on the sample shown in , followed by organic layers removal to form an array of star-shaped nanostructures within the original gold-dot array. Scale bar = 100 nm.
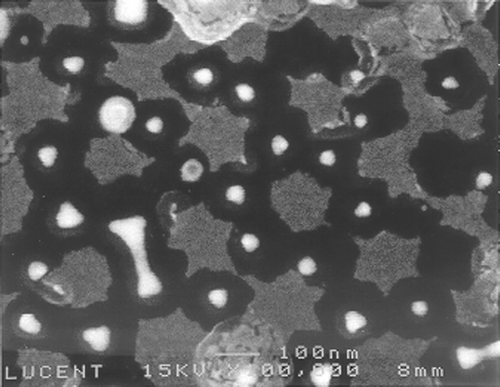
Figure 7. Subsequent gold deposition on the sample shown in figure 5, followed by organic layers removal to form an array of star-shaped nanostructures within the original gold-dot array. Scale bar = 100 nm.

Reprints and Corporate Permissions

Please note: Selecting permissions does not provide access to the full text of the article, please see our help page How do I view content?

To request a reprint or corporate permissions for this article, please click on the relevant link below:

Academic Permissions

Please note: Selecting permissions does not provide access to the full text of the article, please see our help page How do I view content?

Obtain permissions instantly via Rightslink by clicking on the button below:

If you are unable to obtain permissions via Rightslink, please complete and submit this Permissions form. For more information, please visit our Permissions help page.