565
Views
10
CrossRef citations to date
0
Altmetric
Original Articles

Polymer assisted preferential growth of PbS and PbS:Mn nanorods: structural and optical properties

&
Pages 257-267 | Received 01 Sep 2007, Accepted 01 Oct 2007, Published online: 20 Nov 2007

Figures & data

Figure 1. SEM images of PbS nanorods synthesized with polypyrrole concentrations: (a) 5 wt%, (b) 10 wt% and (c) 15 wt%.
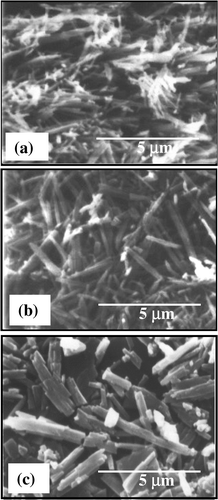
Figure 1. SEM images of PbS nanorods synthesized with polypyrrole concentrations: (a) 5 wt%, (b) 10 wt% and (c) 15 wt%.

Figure 2. TEM image of a representative sample with PbS nanorods synthesized with polypyrrole concentrations 15 wt%. Inset shows the corresponding diffraction pattern.
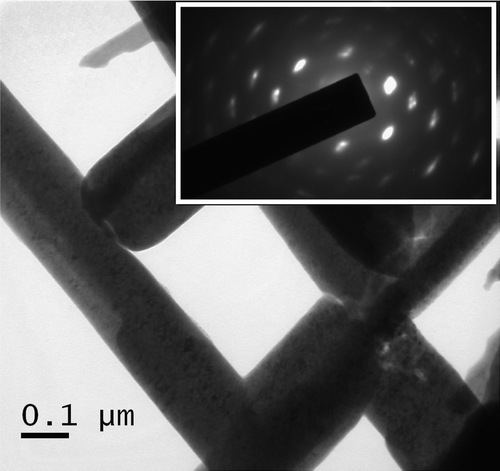
Figure 2. TEM image of a representative sample with PbS nanorods synthesized with polypyrrole concentrations 15 wt%. Inset shows the corresponding diffraction pattern.

Figure 3. FTIR spectra of PbS nanorods synthesized at a polypyrrole concentration 5 wt% with different % molar concentration of Mn2+: (a) 0; (b) 2; (c) 4 and (d) 6.
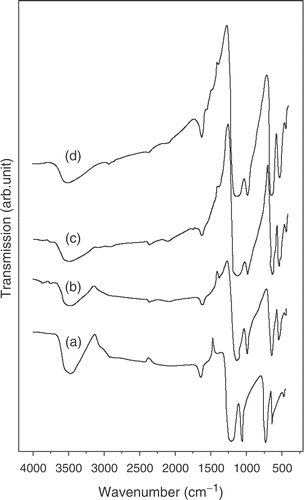
Figure 3. FTIR spectra of PbS nanorods synthesized at a polypyrrole concentration 5 wt% with different % molar concentration of Mn2+: (a) 0; (b) 2; (c) 4 and (d) 6.

Figure 4. XRD spectra (top) of PbS nanorods synthesized at a polypyrrole concentration 5 wt% with different % molar concentration of Mn2+: (a) 0; (b) 2; (c) 4 and (d) 6. The data are compared with bulk PbS given in (e).
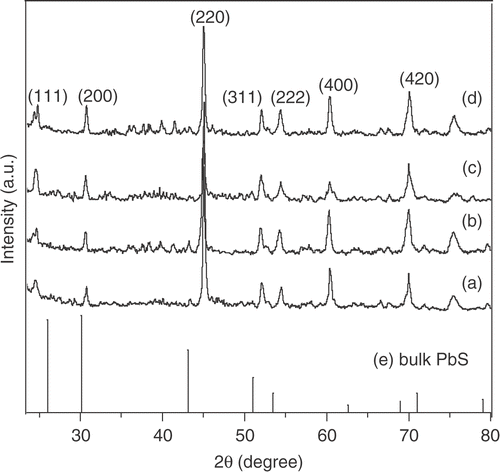
Figure 4. XRD spectra (top) of PbS nanorods synthesized at a polypyrrole concentration 5 wt% with different % molar concentration of Mn2+: (a) 0; (b) 2; (c) 4 and (d) 6. The data are compared with bulk PbS given in (e).

Figure 5. Schematic model for the growth of PbS nanorods in polymer (a): initial nucleation of PbS fine particles, (b)–(d): subsequent preferential growth of nanorods under suitable hydrothermal conditions and polymer rich solution.
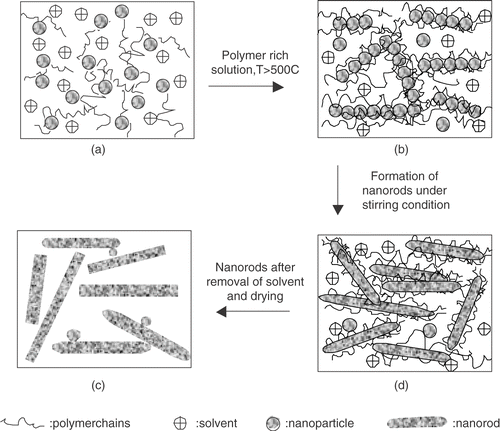
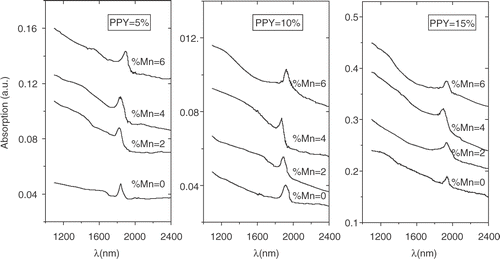
Figure 5. Schematic model for the growth of PbS nanorods in polymer (a): initial nucleation of PbS fine particles, (b)–(d): subsequent preferential growth of nanorods under suitable hydrothermal conditions and polymer rich solution.
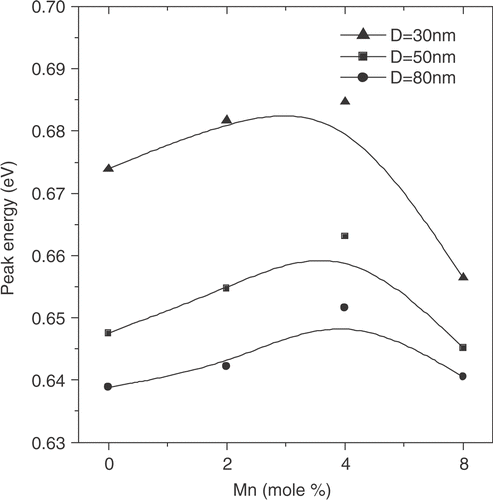
Figure 6. Optical absorption spectra of Mn2+ doped (molar concentration 0 to 6%) PbS nanorods corresponding to different concentration of polypyrrole: 5 wt%, 10 wt% and 15 wt%.

Figure 6. Optical absorption spectra of Mn2+ doped (molar concentration 0 to 6%) PbS nanorods corresponding to different concentration of polypyrrole: 5 wt%, 10 wt% and 15 wt%.

Figure 7. Shift of the optical absorption peak energy with different Mn2+ concentrations in PbS:Mn nanorods.

Figure 7. Shift of the optical absorption peak energy with different Mn2+ concentrations in PbS:Mn nanorods.

Reprints and Corporate Permissions

Please note: Selecting permissions does not provide access to the full text of the article, please see our help page How do I view content?

To request a reprint or corporate permissions for this article, please click on the relevant link below:

Academic Permissions

Please note: Selecting permissions does not provide access to the full text of the article, please see our help page How do I view content?

Obtain permissions instantly via Rightslink by clicking on the button below:

If you are unable to obtain permissions via Rightslink, please complete and submit this Permissions form. For more information, please visit our Permissions help page.