Figures & data
Figure 1. (a) Schematics of a microfluidic device with integrated pH electrodes designed to trap single cardiac myocytes in a 160 pL volumes and to measure the metabolic activity: A–micro-electrode array (red); B–microfluidic network (black); 1–input port; 2–output port; 3–control port; 4, 5–toxin or stimuli port. (b) Detailed view of pH IrOx microelectrodes, stimulation electrodes and the cell trap with loading and waste channels. (c) Optical image of the IrOx pH sensitive microelectrodes (the width of electrodes is 40 µm) and the Pt stimulation electrode.
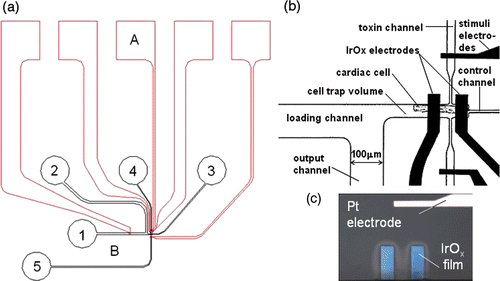
Figure 2. Bottom view of the microfluidic device with mechanical valves sealed to the glass substrate with pH sensing and stimulation electrodes. (a) Microfluidic device with 3 valves filled with a red dye (black–Pt electrodes; red–microfluidic channels: 100 µm wide, 20 µm tall), (b) Bottom view of a channel filled with red dye; the valve is open, (c) Bottom view of a channel that is completely closed by rotating the screw.
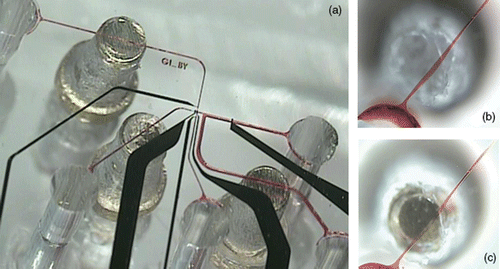
Figure 3. (a) Open circuit potential of a IrOx pH sensitive electrode during periodic cycling of 5 different standard pH calibration solutions with 30 s measurement intervals. (b) Long-term stability measurement of the open circuit potential between iridium oxide electrodes (pH electrode 1 and 2) versus a standard reference electrode in Tyrode's solution. Insert–average potentiometric response of thin film iridium oxide pH electrode in buffer solutions with a pH in the range from 3–12.
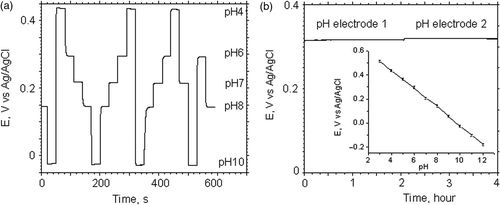
Figure 4. (a) Open circuit potential between IrOx pH sensing and DriRef-450 reference electrode in the input channel during a acidification rate measurements on single cardiac myocytes. The inset shows a detailed view of cardiac myocyte cell in the cell trap volume in the initial and the final stage of experiment. (b) Acidification rate measurement of single cardiac myocytes in standard Tyrode's solution at different Ca2+ concentrations. For Cardiac myocytes we measured an average acidification rate 6.45 ± 0.4 mpH/min (t-test p < 0.00003, n = 8) in 0.8 mM Ca2+ and 11.96 ± 1.3 mpH/min (t-test p < 0.00004, n = 9) in 1.8 mM Ca2+.
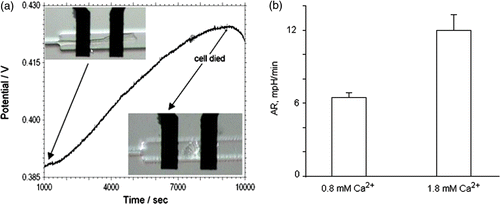
Figure 5. (a) Time course of the open circuit potential of the IrOx pH microelectrode during an acidification rate measurement on single cardiac myocytes in a 160 pL volume in normal Tyrode's solution with 1.8 mM Ca2+. The arrows indicate when spontaneous contraction takes place. The inset shows a detail view of the two configurations used for electrical stimulation of single cardiomyocytes, (c) Electrical simulation is parallel (d) and perpendicular to the longitudinal direction of the cardiac myocytes. 1, 2, 6–iridium oxide pH sensitive electrodes; 3, 4, 5, 7–stimulation electrodes. (b) Time course of open circuit potential of pH measurement of cardiac myocyte single cell during short bursts of electrical stimulation (10 pulses, amplitude 1.5 V; duration 10 ms; frequency 1 Hz).
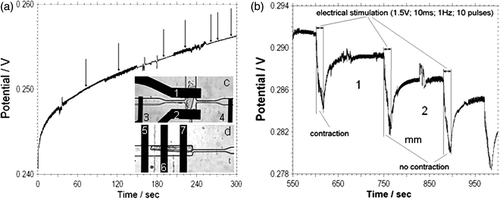
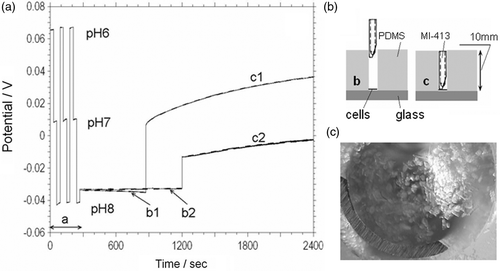
Figure 6. (a) Acidification rate measurements (MI-413 combination pH electrode) on the freshly isolated (b1, c1) and 3 hour post isolation (b2, c2) cardiac myocytes suspended into 0.7 mm3 (curve c1 and c2) and 12 mm3 (curve b1 and b2) volume respectively. Period a–calibration of pH electrode in three different buffer solutions. (b) Cross-sectional schematic view of the MI-413 electrode during pH measurements in 12 mm3 (b) and 0.7 mm3 (c) volumes. (c) Optical image of cardiac myocyte cells and MI-413 electrode during pH measurements in a 0.7 mm3 volume.