Figures & data
Figure 1. Schematic diagram of TiO2–SiO2 mixed oxide preparation.
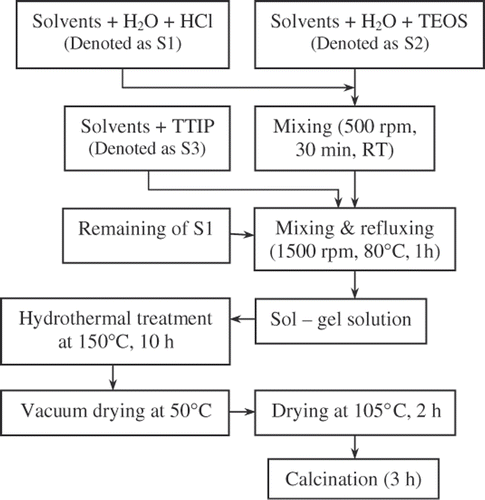
Figure 2. FE-SEM images of different catalysts. (a) TiO2; (b) TiO2–SiO2 and (c) N–TiO2–SiO2.
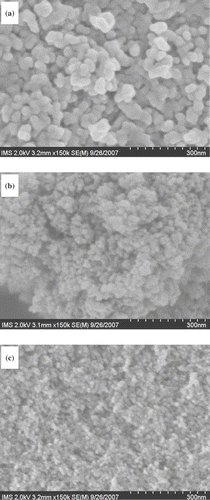
Figure 3. (A) XRD patterns of N–TiO2–SiO2 calcined at different temperatures: (a) 350°C, (b) 400°C, (c) 450°C, (d) 500°C, (e) 550°C, (f) 600°C, (g) 700°C, (h) 900°C and (j) TiO2 (P25-Degussa); (B) XRD patterns of different catalyst: (a) N–TiO2–SiO2–550, (b) TiO2–SiO2–550, (c) TiO2–550 and (d) TiO2 (P25-Degussa).
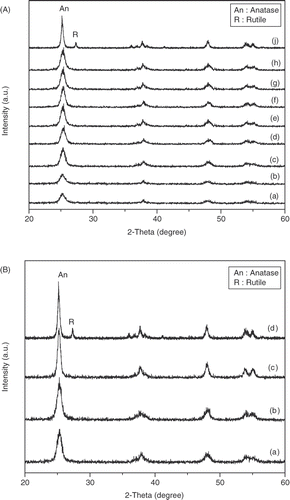
Table 1. BET specific surface areas of different catalysts.
Figure 4. UV-vis DRS of N–TiO2–SiO2 mixed oxide calcined at different temperatures.
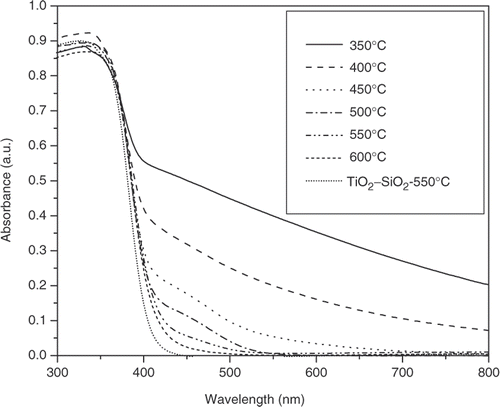
Table 2. Phenol removal efficiency of different catalysts under UVA irradiation.
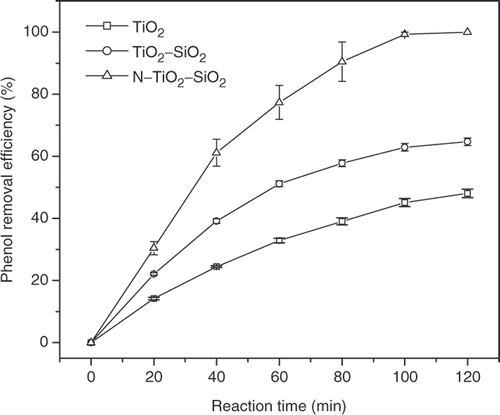
Figure 5. Phenol removal efficiency of different catalysts according to time under natural sunlight. The experiment was carried out outdoor in Hochiminh city from 11:00 am to 13:00 pm on 17 September, 2007 with the average light intensity of 80 klux.