1,561
Views
11
CrossRef citations to date
0
Altmetric
Original Articles

Time-resolved photoluminescence decay characteristics of bovine serum albumin-conjugated semiconductor nanocrystallites

, , &
Pages 177-191 | Received 23 Sep 2008, Accepted 04 Mar 2009, Published online: 22 May 2009

Figures & data

Figure 1. A typical flow chart diagram for obtaining (a) unconjugate CdS- and CdZnS-NCs and (b) thiol-capped and BSA-conjugated CdS NCs.
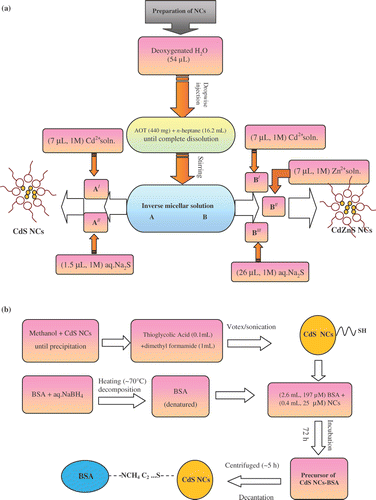
Figure 1. A typical flow chart diagram for obtaining (a) unconjugate CdS- and CdZnS-NCs and (b) thiol-capped and BSA-conjugated CdS NCs.

Figure 2. Optical absorption spectra (OAS) of (a) CdS, (b) CdZnS and (c) Cd0.25Zn0.75S-NCs systems. Numbers (1), (2) and (3) represent untreated, thiol-stabilised and BSA-NCs conjugates, respectively.
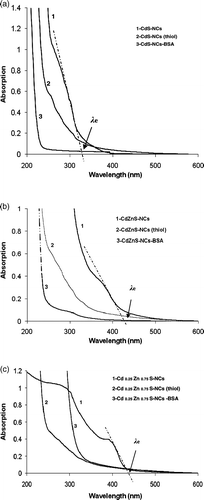
Figure 2. Optical absorption spectra (OAS) of (a) CdS, (b) CdZnS and (c) Cd0.25Zn0.75S-NCs systems. Numbers (1), (2) and (3) represent untreated, thiol-stabilised and BSA-NCs conjugates, respectively.

Figure 3. High resolution electron microscopy images of (a) CdS-NCs and (b) CdS-BSA conjugates. A magnified view of isolated, spherical CdS-NCs (∼2 nm) is shown in the figure inset–(a).
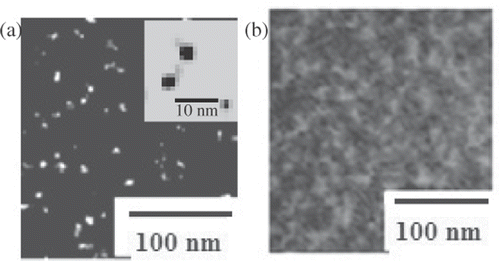
Figure 3. High resolution electron microscopy images of (a) CdS-NCs and (b) CdS-BSA conjugates. A magnified view of isolated, spherical CdS-NCs (∼2 nm) is shown in the figure inset–(a).

Figure 4. Steady-state PL spectra of (a) CdS, (b) CdZnS and (c) Cd0.25Zn0.75S-NCs systems. Figure insets represent spectral responses in the selective wavelength range (400–460 nm) highlighting prominent peak positions. Symbols (−), (▴) and (□) correspond to untreated, thiol-stabilised and BSA-NCs conjugates, respectively.
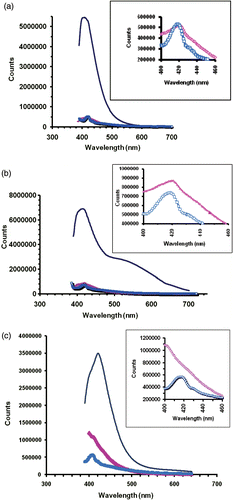
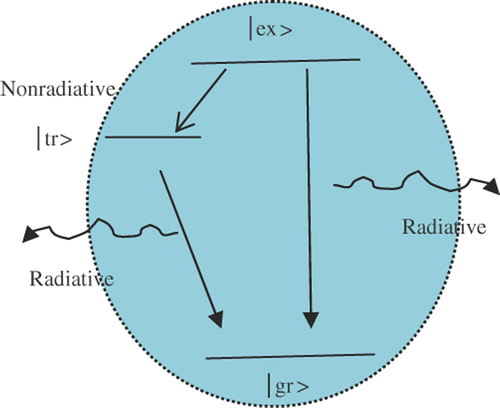
Figure 4. Steady-state PL spectra of (a) CdS, (b) CdZnS and (c) Cd0.25Zn0.75S-NCs systems. Figure insets represent spectral responses in the selective wavelength range (400–460 nm) highlighting prominent peak positions. Symbols (−), (▴) and (□) correspond to untreated, thiol-stabilised and BSA-NCs conjugates, respectively.
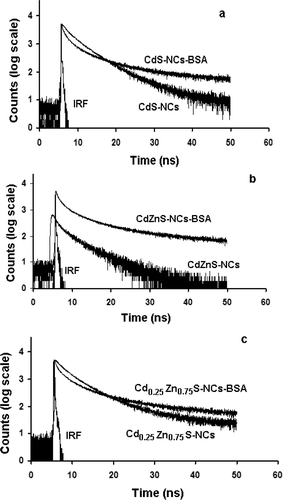
Figure 5. Schematic view of the radiative emission process in NCs.

Figure 5. Schematic view of the radiative emission process in NCs.

Table 1. PL-decay constants for various Cd1− x Zn x S-NCs and BSA conjugates.

Figure 6. Time-resolved photoluminescence spectra (λ ex = 375 nm; λ em = 430 nm) of (a) CdS, (b) CdZnS and (c) Cd0.25Zn0.75S-NCs systems.

Figure 6. Time-resolved photoluminescence spectra (λ ex = 375 nm; λ em = 430 nm) of (a) CdS, (b) CdZnS and (c) Cd0.25Zn0.75S-NCs systems.

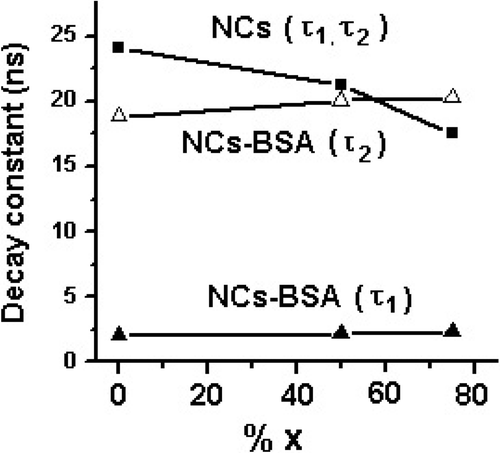
Figure 7. Decay time constant vs. stoichiometry (% x, Zn) for Cd1− x Zn x S-NCs and BSA conjugates.

Figure 7. Decay time constant vs. stoichiometry (% x, Zn) for Cd1− x Zn x S-NCs and BSA conjugates.

Reprints and Corporate Permissions

Please note: Selecting permissions does not provide access to the full text of the article, please see our help page How do I view content?

To request a reprint or corporate permissions for this article, please click on the relevant link below:

Academic Permissions

Please note: Selecting permissions does not provide access to the full text of the article, please see our help page How do I view content?

Obtain permissions instantly via Rightslink by clicking on the button below:

If you are unable to obtain permissions via Rightslink, please complete and submit this Permissions form. For more information, please visit our Permissions help page.