Figures & data
Figure 1. Chronological distribution of pieces in the TP3C corpus.
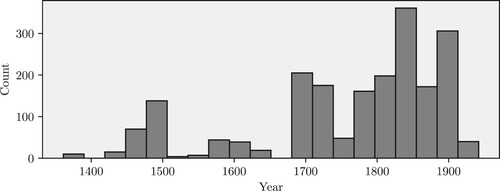
Table 1. Five most frequent composers and numbers of pieces per century in the corpus.
Figure 2. Schematic depiction of the twelve neutral pitch-classes in on the circle of fifths. One representative of each neutral pitch-class is shown as a tonal pitch-class label next to the node. The colouring of the nodes corresponds to the colours of the keys on the piano.
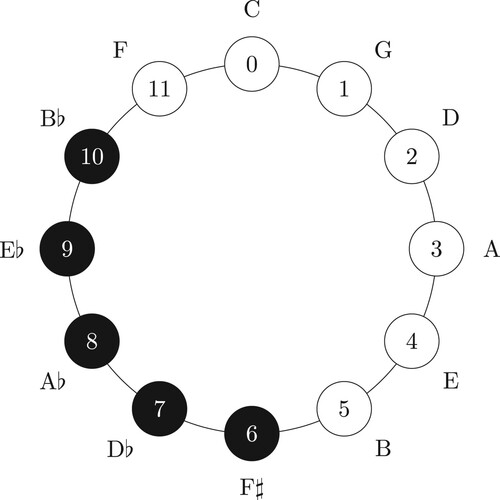
Figure 3. Schematic depiction of the tonal pitch-classes on the line of fifths mapped to integers in .
Figure 4. Relative frequencies of pitch classes per piece in the corpus (colored dots). The average frequency of pitch classes is shown by black dots, and the white bands around the averages correspond to 95% confidence intervals based on 10,000 bootstrapped samples.
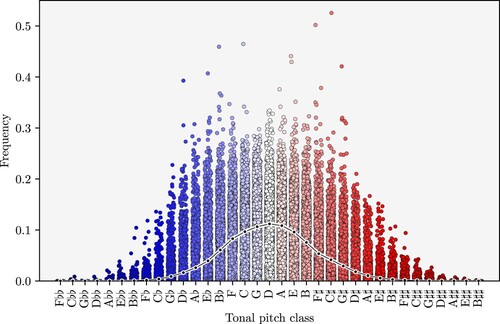
Figure 5. Dimensionality reduction via PCA. Points represent pieces and the colouring corresponds to the position of the tonal centre of each piece on the line of fifths.
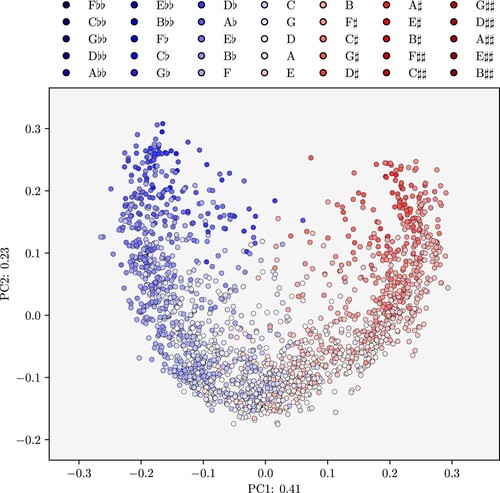
Figure 6. First two principal components for the tonal pitch-class distributions.
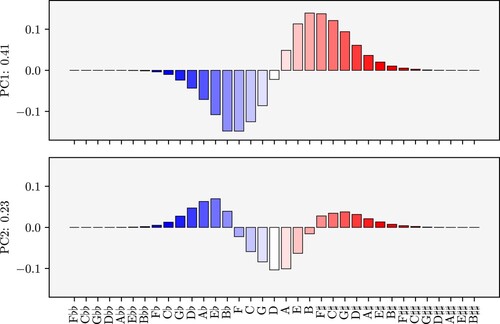
Figure 7. Diachronic changes in the fifth-range of tonal pitch-class distributions of musical pieces, shown as LOWESS trend lines. Selected pieces with minimal (Desprez, Satie) and maximal (Chopin) fifths range are marked with a cross. A slight jitter has been added to the scatter plot to avoid overlapping points (not affecting the LOWESS curves).
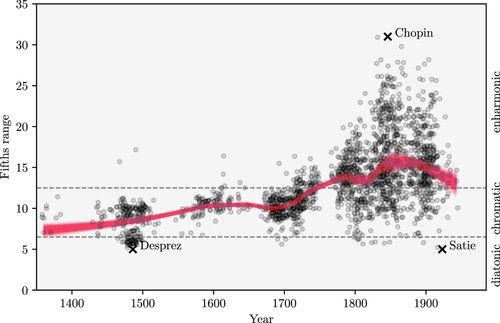
Figure 8. Two distinct ways of composing out a hexachord. Top: Josquin Desprez, Missa sine nomine, Agnus Dei II (1514); bottom: Erik Satie, Ludions, no. 4 “Air du poète” (1923).16
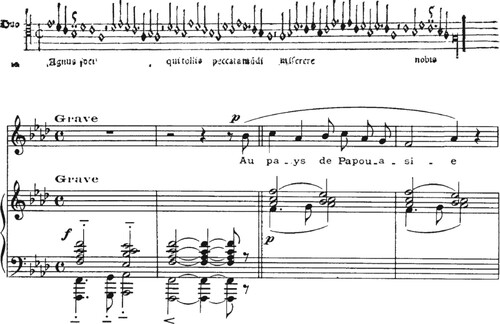
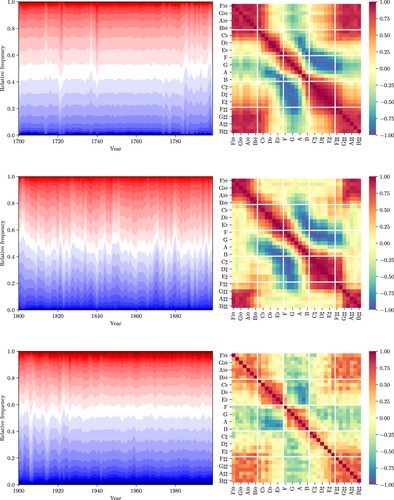
Figure 9. The evolution of tonal pitch-classes for those years where the corpus contains pieces. The coloured bands show the relative frequencies of tonal pitch-classes in the corpus for any given year. The black dots show the normalized entropy over the pitch-class distributions in each year, and the black line shows a linear regression. The heatmap shows correlations between relative pitch-class frequencies.
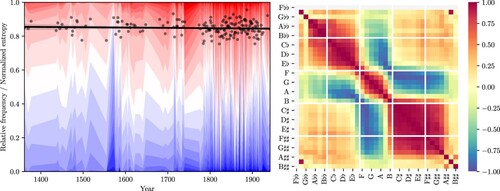
Figure 10. Two-dimensional PCA reduction of tonal pitch-class co-evolution. The black line connecting pitch classes along the line of fifths has been added post hoc.
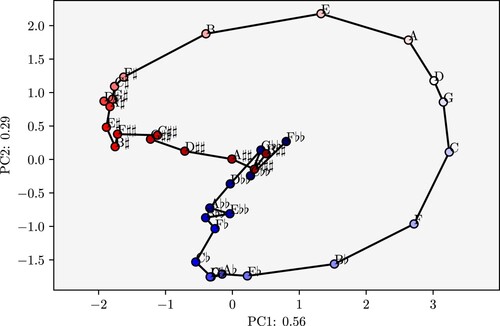
Figure 11. Separate plots of the first two principal components jointly accounting for 85% of the variance in the data.
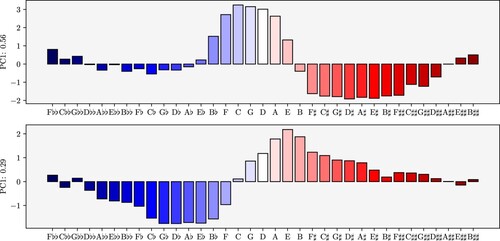
Figure 12. The co-evolution of tonal pitch-classes for the 15th, 16th, and 17th centuries.
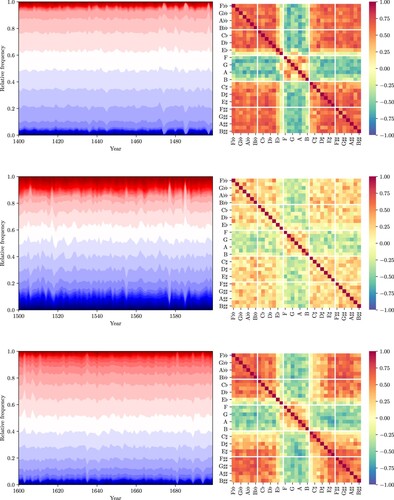
Figure 13. The co-evolution of tonal pitch-classes for the 18th, 19th, and 20th centuries.