Figures & data
Figure 1. MMPs and ACs. Shown is a pair of kinase inhibitors forming a transformation size-restricted MMP and AC. The large potency difference is due to a single heteroatom replacement.
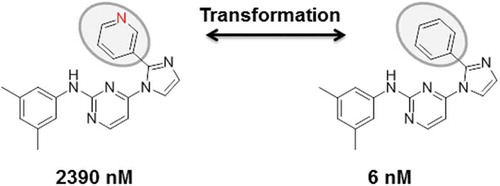
Figure 2. 3D-ACs and 2D extensions. Shown is a 3D-AC formed by thrombin inhibitors (top). Crystallographic inhibitors were aligned by superposing the thrombin structures from their complexes and their 3D similarity was quantified. Molecular graphs of the 3D-AC inhibitors are shown below the X-ray structure (boxed). In addition, for each inhibitor, two structurally analogous thrombin inhibitors are displayed (bottom) that were identified by 2D-MMP searching (structural modifications are highlighted in red). For all inhibitors, pKi values are reported.
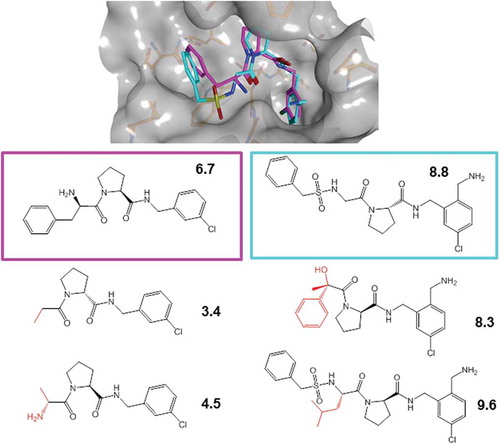
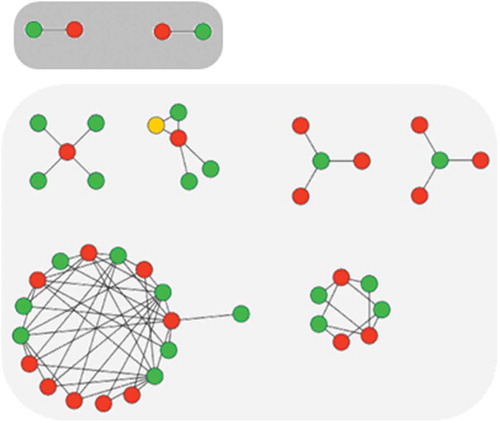
Figure 3. AC network and clusters. Shown is a prototypic AC network for a small set of 46 serotonin receptor ligands (nodes) forming 69 ACs (edges) including two isolated (top; dark gray background) and 67 coordinated cliffs (bottom; light gray background). Green and red nodes indicate highly and weakly potent compounds, respectively, and yellow nodes compounds that are highly or weakly potent partners in different cliffs. Coordinated ACs form clusters of varying size and topology.