Figures & data
Table 1. Reported experimental thermodynamic data for fragment–protein binding.

![Figure 1. (a) Logarithmic plot of affinity (pKd[max]) of the most potent ligands versus the number of heavy atoms (HAC). (b) Logarithmic plot of maximal favorable enthalpy (pKH[max]; black round markers and straight line), and enthalpy of the most potent ligands (pKH[pKdmax]; red square markers and dashed line) versus the number of heavy atoms (HAC). Data were binned by ΔHAC = 3 and maximal values in each bin are shown. Based on data from Ref. [Citation1].](/cms/asset/7bdf36f9-0f32-47f9-a832-081267c7ae76/iedc_a_1691166_f0001_oc.jpg)
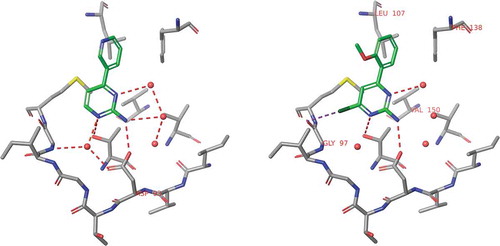
![Figure 6. Experimental binding modes of the 2-fluoro and 3-fluoro benzenesulfonamides at the binding site of human carbonic anhydrase. The 2-fluoro group points toward the hydrophilic wall (green) of the binding site. Contrary, the 3-fluoro group is located in a dominantly hydrophobic subpocket that is preferred by all the other halogens and also the nitriles used at different positions. Copyright: Royal Society of Chemistry [Citation94] https://pubs.rsc.org/en/content/chapter/bk9781849733533-00023/978-1-84973-353-3.](/cms/asset/7c52232e-1a5a-46ce-9977-f47c29ef3960/iedc_a_1691166_f0006_oc.jpg)