Figures & data
Figure 1. Schematic illustration of SPR to determine binding interactions of representative small molecule ligand (molecule in the black circle) to target protein (blue): (a) Analytes (small molecule ligands; black circle) are passed through microfluidic system (buffer) and flown over the receptor (target protein; blue ribbon structure) immobilized on the chip surface. Polarized light is directed through a prism and incident upon bottom side of sensor chip (surface of the gold film) where waves of surface plasmons are generated at the critical angle of incident light; (b) After analytes bind to the receptor, there is a change in the critical angle of the incident light and reflected as I and II; (c) SPR sensogram comprising of the association phase (I) and the dissociation phase (II). SPR response values are expressed in resonance units (RU).
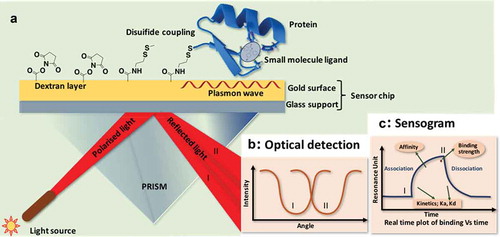
Table 1. Application of surface plasmon resonance (SPR), high-resolution Orbitap mass analyzer and Raman advancement in the area of drug discovery and delivery.
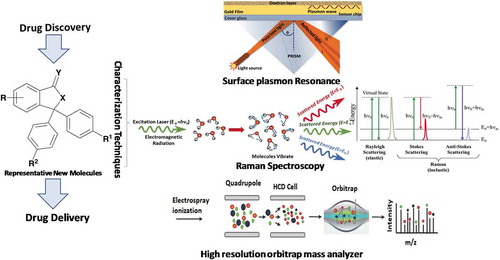
Figure 2. Schematic illustration of SPR, high-resolution orbitrap mass analyzer and Raman mechanism.