Figures & data
Figure 1. Experimental design.
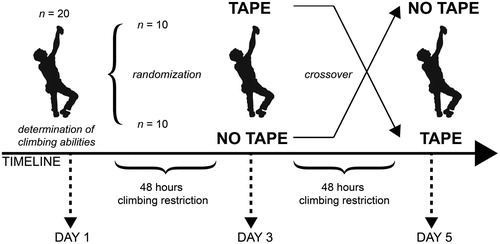
Table I. Anthropometric, climbing ability, and grip strength of male (n = 10) and female (n = 10) participants.
Figure 2. Performance measurements with (TAPE) and without (CONTROL) kinesio tape application for a) fatigue index (FI), b) peak grip force (Fmax), c) hang time, d) Lamax, e) lap climbing time (LCT), and f) lap climbing distance (LCD). Data points represent individual values (○). Bar charts are means ± SD. See METHODS for further details.
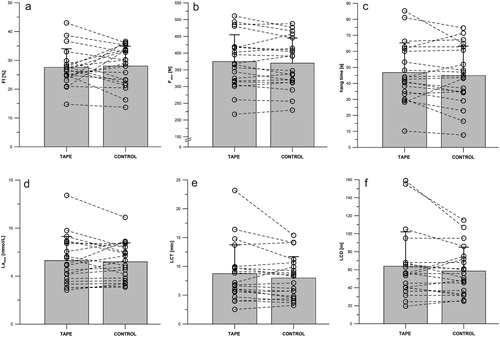
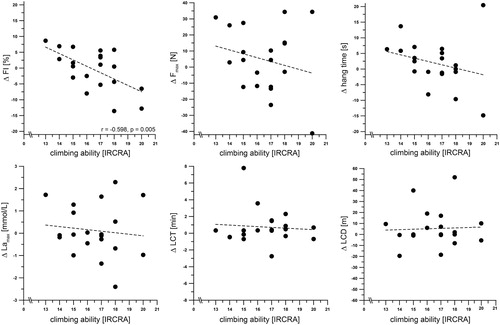
Figure 3. Relationships between IRCRA climbing ability and the intra-individual performance changes between the TAPE and CONTROL conditions (Δ FI, Δ Fmax, Δ hang time, Δ LCT, Δ LCD), as well as the associated physiological response (Δ Lamax). Data points represent individual values. See METHODS for further details, *p < 0.05.