Figures & data
Figure 1. Schematic of experimental protocol detailing the order of events on each laboratory visit.
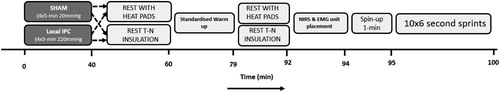
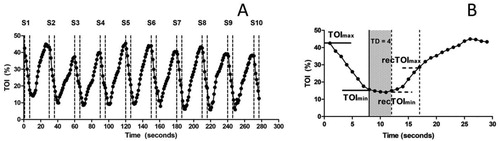
Figure 2. (a) Typical NIRS muscle oxygenation data during 10 × 6-s all-out sprints and (b), an example of a single 6-s sprint, followed by a 24-s recovery. Assessment of NIRS data during sprints was obtained from the first 7 s of effort, accounting for any additional pedal strokes. Deoxygenation amplitude (DeoxyAMP) and slope (Deoxyslope) were calculated from the maximal (TOImax) and minimal (TOImin) values (horizontal solid lines). Time Delay (TD) was defined as the time (s) from post-sprint to the beginning of muscle reoxygenation. Mean TD was 2.11 ± 0.95 s. Recovery amplitude (ReoxyAMP) and rate (Reoxyslope) were calculated from maximal (recTOImax) and minimal (recTOImin) values (horizontal dashed lines). TOI; Tissue oxygenation index, S1-10; Sprint number.