
Figures & data
Table 1. Questions in the questionnaire, per section of the questionnaire.
Figure 1. Age at which scouts perceive they can predict performance, stratified by age cohort of players scouted (error bars indicate ± SD). Each dot indicates a scout answer.
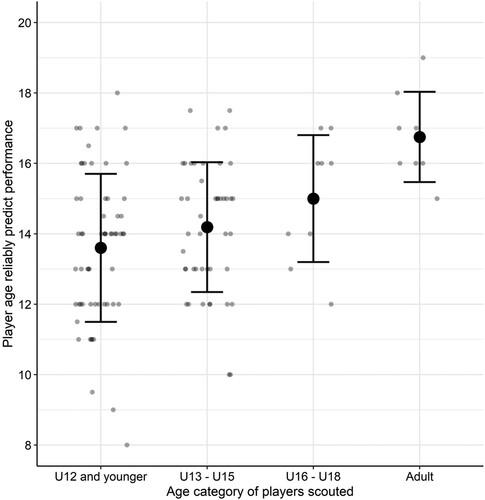
Table 2. Attributes scouts considered predictive of future soccer performance, in terms of total frequency (k) and the number of times each attribute was considered most predictive (1st).
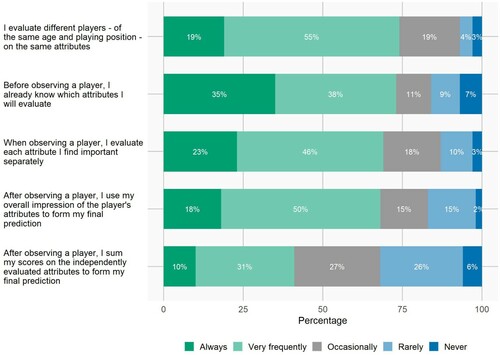
Figure 2. Response percentages to the statements on the different aspects of structures that scouts apply when assessing players.
Supplemental Material
Download MS Word (40.8 KB)Data availability statement
The dataset associated with the main analyses can be accessed through a Dataverse repository (https://doi.org/10.34894/LKDXFD). The data has been made available without restrictions and can be accessed by all interested parties.