Figures & data
Figure 1. Representative data during an incremental exercise test in a female participant. The white box indicates the rest period. The gray box indicates the warm-up period, during which the participant cycled at 10 W. The black box indicates the period of 10-W incremental increases in exercise workload every minute until exhaustion. The black arrow indicates the workload at the LT. HF, high-frequency component; HR, heart rate; LF, low-frequency component; W-up, warm-up.
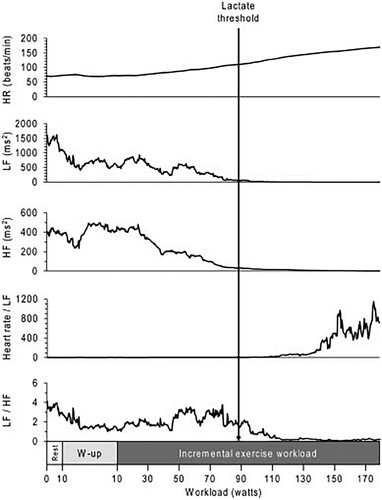
Table 1. Physiological parameters and heart rate variability components in each stage during the incremental exercise test.
Figure 2. Changes in HRV components and physiological parameters before and after reaching the LT. Data are shown the mean ± SD. A, HRV components (Heart rate/LF, n = 14–15; LF/HF, n = 14–15) and HR (n = 15). B, Blood parameters (adrenaline, n = 10–12; noradrenaline, n = 10–12; blood lactate, n = 14–15). C, Respiratory gas parameters (⩒O2, n = 15; ⩒CO2, n = 15; RQ, n = 15). The relative intensity of workload with respect to the LT is shown in the horizontal axis. The obtained values were averaged as percentage ranges. *p < 0.05 at rest vs. each relative intensity. HF, high-frequency component; HR, heart rate; LF, low-frequency component; LT, lactate threshold; RQ, respiratory quotient; ⩒O2, oxygen uptake; ⩒CO2, carbon dioxide production.
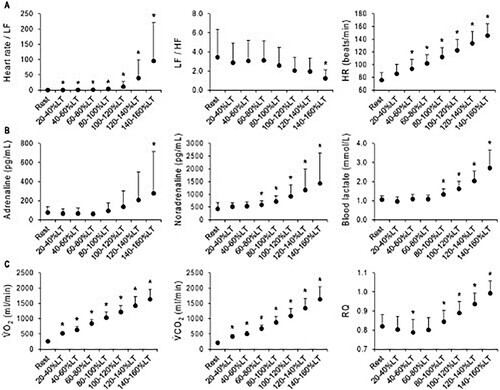
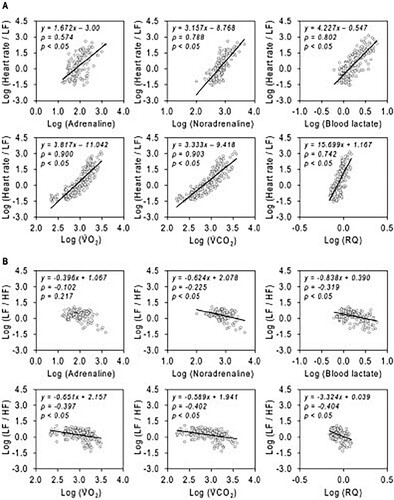
Figure 3. Correlations between HRV components and physiological parameters. All data are the values from at rest to until the blood lactate reached 4 mmol/L. All data are presented as logarithms (log). (A) The correlation between Heart rate/LF and blood, respiratory gas parameters. (B) The correlation between LF/HF and blood, respiratory gas parameters. HF, high-frequency component; HR, heart rate; LF, low-frequency component; RQ, respiratory quotient; ⩒O2, oxygen uptake; ⩒CO2, carbon dioxide production.