Figures & data
Table 1. Prescribed values from Jalilvand et al. (Citation2019) and the mean ± SD or mean (95% confidence interval) of each value from the 1000 initial simulated data sets, prior to values being perturbed and investigated.
Table 2. Mean (95% confidence interval) Pearson’s product moment correlation coefficient’s via Fisher’s z transformation (r: white background) and associated mean p-values (grey background) for each bivariate combination of simulated parameters from the 1000 initial simulated data sets prior to values being perturbed and investigated. Bold text: these three correlations were prescribed based on Jalilvand et al. (Citation2019).
Figure 1. At each prescribed correlation between countermovement jump height and 0–5 m sprint average velocity (r = −0.3–0.99 in increments of 0.01), 1000 data simulations were run with a sample of n = 25. This figure shows the mean (and 95% confidence interval: shaded area) correlation coefficient between jump vertical take-off momentum (JM) and sprint average anterior momentum (SM) for each set of 1000 simulations, calculated via Fisher’s z transformation. The jump momentum – sprint momentum correlation increases as the jump height – sprint velocity correlation increases.
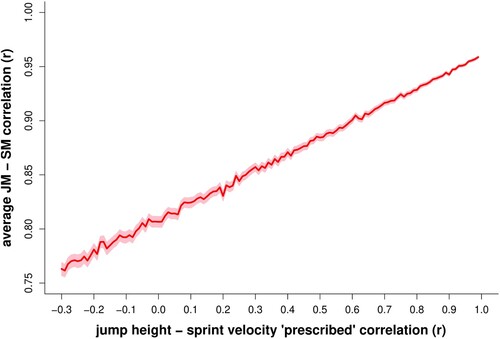
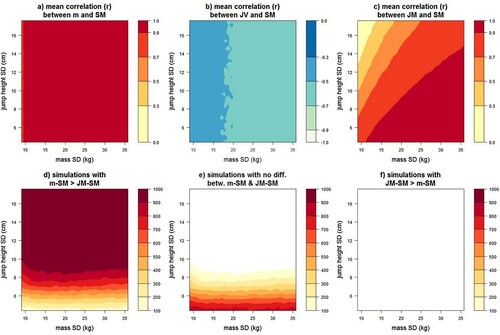
Figure 2. At each combination of prescribed body mass standard deviation (SD; 8.95 kg to 35.8 kg in increments of 0.895 kg) and prescribed countermovement jump height SD (4.4 cm to 17.6 cm in increments of 0.44 cm), 1000 data simulations were run with a sample of n = 25. For each set of 1000 simulations, the top row of this figure shows the mean correlation coefficient (calculated via Fisher’s z transformation) between; (a) body mass (m) and sprint average anterior momentum (SM); (b) countermovement jump vertical take-off velocity (JV) and SM; (c) countermovement jump vertical take-off momentum (JM) and SM. Colours indicate small (r ≤ 0.3), moderate (0.3 < r ≤ 0.5), large (0.5 < r ≤ 0.7), very large (0.7 < r ≤ 0.9), and near-perfect (r > 0.9) correlations. For each set of 1000 simulations, the bottom row of this figure shows the number of data sets for which: (d) the m-SM correlation was significantly (p < 0.05) greater than the JM-SM correlation; (e) there was no significant difference between m-SM and JM-SM correlations; (f) the JM-SM correlation was significantly greater than the m-SM correlation.