Figures & data
Table 1. Summary of participants’ characteristics.
Figure 1. Mean shear rate in the exercise (n = 6) and control groups (n = 5) prior to intervention (Baseline) and at 10, 20 and 30 min. Results are presented as mean ± SD, P < 0.05. *Significantly different from Baseline, †Significantly different from 10 min, #Significantly different from control group.
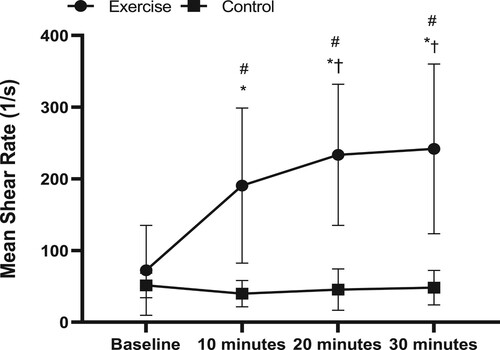
Table 2. Radial artery haemodynamics in the exercise (n = 6) and control groups (n = 5), prior to intervention (Baseline) and at 10, 20 and 30 min.
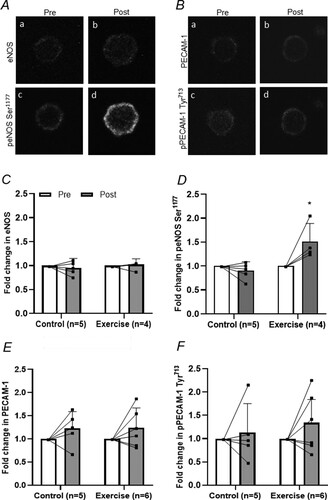
Figure 2. eNOS, eNOS Ser1177 phosphorylation (peNOS), PECAM-1 and PECAM-1 Tyr713 phosphorylation (pPECAM-1) in the exercise and control groups pre- and post-intervention. A, Representative confocal microscopy images of radial artery endothelial cells (EC)s stained for eNOS (a, b) and peNOS Ser1177 (c, d) pre (a, c) and post (b, d) handgrip exercise, images are taken from the same participant from the exercise group. B, Representative confocal microscopy images of radial artery EC stained for PECAM-1 (a, b) and pPECAM-1 Tyr713 (c, d) pre (a, c) and post (b, d) handgrip exercise, images are taken from the same participant from the exercise group. Mean fluorescence intensity of eNOS; C, peNOS Ser1177; D, PECAM-1; E, and pPECAM-1 Tyr713; F is summarised. The mean fluorescence intensity pre intervention was assigned a value of 1, and the relative intensity post intervention was calculated. Results are mean ± SD, *Significantly different from Pre (P < 0.05).